

DRAFT LONG-TERM PLAN 2024-2034
Takingthenextsteps
Our 10 year plan
Mahere Tekau Tau 2024-2034
1 | Page
2 | Page Contents DRAFT LONG-TERM PLAN 2024-2034 1 He mihi .....................................................................................................................................................................6 Contents – Te Reo Māori and English 7 Message from the Mayor and Chief Executive................................................................................8 Partnership with Mana Whenua and Mātawaka..........................................................................10 Welcome to our draft 10 Year Plan 2024 - 2034 11 How to read this plan....................................................................................................................................14 Challenges we are all facing 15 To take the next steps 20 The Principle: Promoting the wellbeing of all people........................................................... 21 Our contribution to enhancing Māori wellbeing 21 Priority 1: Future-fit infrastructure 22 Priority 2: Enabling a liveable city and vibrant neighbourhoods 22 Priority 3: Supporting and enhancing the environment........................................................ 23 Our finances at a glance 24 What you said about this 10 Year Plan 32 Introduction to the Statements of Service Performance Chapter...................................33 How to read this Chapter...................................................................................................... 34 Introduction to Environmental Wellbeing Section .....................................................................35 Environmental Wellbeing Dashboard 36 Stories for Environmental Wellbeing....................................................................................................37 Ngā puna wai | Water supply..................................................................................................................39 Waiparu | Wastewater.................................................................................................................................43 Waiāwhā | Stormwater................................................................................................................................47 Para | Solid waste 51 Whakauka me te Manawaroa | Sustainability and resilience............................................55 Ngā Ratonga Waeture | Regulatory services................................................................................58
3 | Page Oranga Ōhanga - Economic Wellbeing 61 Introduction to Economic Wellbeing Section................................................................................62 Economic Wellbeing Dashboard...........................................................................................................63 Stories for Economic Wellbeing 65 Ngā waka | Transport...................................................................................................................................66 Whanake tāone | City development.....................................................................................................71 Oranga Hapori me te Oranga Ahurea - Social & Cultural Wellbeing............................75 Introduction to Social & Cultural Wellbeing Section ................................................................76 Social & Cultural Wellbeing Dashboard 77 Stories for Social & Cultural Wellbeing 78 Subsections for Social & Cultural Wellbeing.................................................................................79 Hō mātou rangapū hapori me te mahi ngātahi | Community partnering and support..................................................................................................................................................................80 Papa rēhia me ngā whenua tāpui | Open spaces, parks and reserves.......................84 Ngā herengatanga, auahatanga, akoranga me ngā mahi a te rēhia | Connectivity, creativity, learning and recreation.......................................................................89 Kāwanatanga, ko te rautaki me ngā kīwei o te kete | Governance, strategy and partnerships.......................................................................................................................................................94 Ratonga rangatōpū | Corporate Services 97 Ngā whakatau me ngā whakapae o te kawe ratonga...........................................................99 Service performance judgements and assumptions..............................................................99 Ngā rautaki, ngā kaupapa here, me ngā whakapae - Strategies, policies and assumptions.....................................................................................................................................................103 Significant forecasting assumptions 104 Financial strategy...........................................................................................................................................114 Summary and overview.........................................................................................................................115 Section A: Introduction and setting the scene 117
4 | Page Section B: Our financial position leading into the preparation of the 10-year plan.....................................................................................................................................................................118 Section C: Financial strategy guiding principles for the 10-year plan 120 Section D: Capital expenditure programme 122 Section E: Operational expenditure ...............................................................................................126 Section F: Borrowings and investments ......................................................................................128 Section G: Balancing the operating budget..............................................................................131 Section H: Rates and rates increases...........................................................................................133 Appendix 1: Further explanation about our approach to the balanced operating budget..............................................................................................................................................................135 Revenue and financing policy 137 Section A: Introduction 137 Section B: Changes to the policy.....................................................................................................137 Section C: How does Council decide what is funded from where? 137 Section D: Funding of operating expenditure..........................................................................139 Section E: Funding of capital expenditure.................................................................................142 Section F: General rate differential factor 144 Section G: Summary of operational funding sources........................................................147 Infrastructure strategy 178 THE STRATEGY AT A GLANCE 180 INFRASTRUCTURE SUPPORTS TE AWA KAIRANGI KI TAI LOWER HUTT TO BE A LIVEABLE CITY 181 STRATEGY OUTCOMES AND SCOPE.......................................................................................................187 OUR CORE INFRASTRUCTURE NETWORKS IN MORE DETAIL.......................................................188 THE CHANGING FACE OF TE AWA KAIRANGI KI TAI LOWER HUTT ...........................................194 THE NATIONAL AND REGIONAL CONTEXT FOR INFRASTRUCTURE ..........................................199
5 | Page OUR INFRASTRUCTURE CHALLENGES AND RISKS 203 HOW COUNCIL AIMS TO MEET THESE CHALLENGES.....................................................................209 IMPLEMENTING THE STRATEGY..................................................................................................................216 ASSUMPTIONS INFORMING THE STRATEGY 229 FINANCIAL PROJECTIONS............................................................................................................................231 Significance and engagement policy.............................................................................................236 Development and financial contributions policy...........................................................237 Rates remission policy..............................................................................................................................238 Rates postponement policy 239 Ngā ringaringa me ngā waewae o Te Kaunihera - Council controlled organisations 240 Seaview Marina Limited 241 Urban Plus Limited......................................................................................................................................245 Wellington Water Limited .......................................................................................................................248 Hō mātou pūtea - Our finances...................................................................................................249 Financial statements............................................................................................................................250 Notes to the financial statements 253 Prudence reporting.................................................................................................................................269 Funding impact statement including rates for 2024-25..........................................273 Fees and charges 293 Ngā whakamāramatanga – Definitions................................................................................348 Contact details...........................................................................................................................................353 Independent Auditor's Report.........................................................................................................357
He mihi
Ko Te Awa Kairangi he pou herenga iwi, he pou herenga waka.
Here mai ko te kei o tō waka ki te tumu herenga waka o ngā pae mounga kua whakatūtūria nei e te hikuroa o Ngake Mai i Tararua ki Remutaka ki Pūrehurehu, ki Pōkai Mangumangu, ki Pareraho, ki Tirohanga, ki Tukutuku, ki Puke Tirotiro, ki Pukeariki, e whakamarumarutia nei Te Tatau o Te Pō a Ngāti Te Whiti, a Ngāti Tāwhirikura, ki Pukeatua, te tuahu tapu o Te Kāhui Mounga i te wā i a Māui ki te whakapuare i te wahanui o Te Ika Whakarau a Kutikuti Pekapeka.
I ahu mai i Te Wai Mānga, i a Rua Tupua, i a Rua Tawhito, Ko Ngake, ko Whātaitai. Ka timu ngā tai o Te Wai Mānga, ka pari mai ko Te Whanganui a Tara e pōkarekare mai ana.
Ka tū a Pukeatua ki runga i ngā wai e kato ana, i a Awamutu, i a Waiwhetū, kei reira a Arohanui ki te Tangata a Ngāti Puketapu, a Te Matehou, a Ngāti Hāmua e tū ana, tae noa atu rā ki ngā wai tuku kiri o te pūaha o te awa o Te Awa Kairangi.
Koia hoki te puna i heke mai ai he tangata. E kore e mimiti tēnei puna, ka koropupū, ka koropupū. Ko Te Awa Kairangi e rere iho mai ana i hōna pūtakenga i Pukemoumou i te paemounga o Tararua ki runga i hēnei whenua, ki runga i tēnei kāinga, hei āhuru mōwai ngā iwi.
Te Awa Kairangi is a rallying point for the many people and the many tribal affiliations that have made it their home.
Bind yourself to the many mountains of this place that were born from the lashing tail of Ngake. From Tararua to Remutaka, to Pūrehurehu, to Pōkai Mangumangu, to Pareraho, to Tirohanga, to Tukutuku, to Puke Tirotiro, to Pukeariki, to Te Korokoro o Te Mana which stands atop Te Tatau o Te Pō of Ngāti Te Whiti and Ngāti Tāwhirikura, to Pukeatua, the sacred altar of the Mountain Clan in the time of Māui.
It was here that the two ancient tūpuna, Ngake and Whātaitai, were summoned from the depths of the fresh water lake, tasked with prising open the mouth of the great fish.
It is Pukeatua that stands above the waters of Awamutu and Waiwhetū, the home of Arohanui ki te Tangata of Ngāti Puketapu, Te Matehou, and Ngāti Hāmua, flowing out to the life giving waters at the mouth of Te Awa Kairangi.
This is the spring that gives life to the people. This spring which will never be diminished, it will continue to flow, it will continue to flourish. Te Awa Kairangi that flows down from its source at Pukemoumou in the Tararua ranges and over these lands as a sheltering haven for the people.
6 | Page
Contents – Te Reo Māori and English
Will be in full merged version
7 | Page
Message from the Mayor and Chief Executive
Kia ora,Welcome to our Long-Term Plan 2024-2034
Te Awa Kairangi ki Tai Lower Hutt is a growing city with dynamic and diverse communities.
We are home to thousands of businesses and innovators who drive our economy. We have a spectacular coastline, a beautiful river that flows through our city and many green spaces for everyone to enjoy. It’s easy to see why more and more people are choosing to call Lower Hutt home.
We want to do more to ensure that our city is a place where everyone can thrive. We’re working hard to achieve this through the initiatives outlined in our proposed plans which are set out in this 10 Year Plan.
As our city grows there are challenges we need to plan for and opportunities we need to make the most of. Inflation and the rising cost of living are impacting all of us. At the same time, our Council is dealing with a backlog of historic underinvestment in our key infrastructure – shown in our ageing pipes and the risk of future water shortages.
Through our plans we need to strike the right balance between the investment needed and the cost impact on people. Fixing our pipes, seeking feedback on residential water meters, and investing in other water infrastructure are our top priorities. These drive much of the proposed rates increase set out in this draft 10 Year Plan.
We know that more investment is required in our three waters network and that even the proposed $1.6 billion investment will not get us entirely to where we need to be. We’ve balanced affordability for our ratepayers with the need for investment. We are working with central government and colleagues across the region for a better way of delivering water services and to secure investment to ensure they are fit for purpose.
We are continuing the futureproofing of our city through transport and resilience projects including Te Wai Takamori o Te Awa Kairangi (RiverLink), Eastern Hutt Road, and Tupua Horo Nuku (Eastern Bays shared path). Prioritising these projects ensures our city is a safe place where everyone can thrive for decades to come.
This 10 Year Plan has been very challenging to put together. We’ve gone through the budget line-byline to find savings, identify revenue opportunities and made spending cuts before coming up with our proposals. We are not willing to put off the investment that our city sorely needs, nor are we willing to make significant cuts to our core services.
8 | Page
We’ve had to make some difficult calls and after rigorous work we have made $35 million in savings across the board. We’ve also had to ensure we’re prioritising the investment needed to bring critical water and roading infrastructure up to scratch. Thank you for your contribution to this plan that helps us build a connected, resilient and inclusive city where all of our people thrive.
Jo Miller
9 | Page
Ngā mihi nui, Campbell Barry Koromatua Mayor
Tumu Whakarae Chief Executive He karere nā te Koromatua/Tumu Whakara
Partnership with Mana Whenua and Mātawaka
First and foremost is our relationship with Mana Whenua, who have historic and territorial rights in Te Awa Kairangi ki Tai Lower Hutt. The tribal history and legends are based in the lands they have occupied over generations, and the land provides sustenance for the people and enables hospitality for guests.
Mana Whenua interests are represented by five iwi (tribal) organisations and two Mana Whenua marae in Te Awa Kairangi Lower Hutt – Te Tatau o Te Pō and Waiwhetū Marae.
Partnership with Mana Whenua
Council has Tākai Here (Memoranda of Partnership) with the four iwi organisations representing Mana Whenua and iwi Māori in Te Awa Kairangi Lower Hutt.
These take a covenant approach, reflect iwi strategic plans, and align with Council and iwi aspirations.
More information about Mana Whenua partnerships can be found here
10 | Page
Welcome to our draft 10 Year Plan
2024 - 2034
Taking thenext steps (sub header)
Every three years, Hutt City Council prepares a 10 Year Plan that sets out the initiatives and services we plan to fund over the following 10 years. Council adopted our last 10 Year Plan in 2021, and this year it’s time for us to review and adopt a new 10 Year Plan.
Over the last three years we have successfully focussed on getting the basics right. Now we are asking you to help us take the next steps in making Te Awa Kairangi Lower Hutt a great place to live now and into the future.
In 2021 it was clear there was a need and a strong desire from the community to invest in the basics like water infrastructure, our transport network, housing, and resilience measures due to the changing climate and increasing severe weather events. Now Council is taking the next steps on our journey. We remain focused on our goal of providing fit for purpose infrastructure enabling a more connected, resilient, and inclusive city where all of our people can thrive.
The economic conditions have become much more challenging since 2021. Te Awa Kairangi Lower Hutt is dealing with the consequences of historic underinvestment in ageing infrastructure, record population growth and more frequent weather events that are disrupting the city and affecting the roading network. In addition, we are facing increasing costs across the board including higher interest rates, inflation and extra insurance costs.
As you read the updated 10 Year Plan, you will see we have outlined the key infrastructure projects that will help Council address the challenges the community is facing. We are still focussed on resilience and investing in core water and transport infrastructure but know that these will take time to fix properly. We have also looked closely at our other activities and services in the 10-year budget with the economic climate and cost of living in mind.
Upgrading our city’s infrastructure remains a key area of focus, in particular our water services. Council’s Infrastructure Strategy shows how we are taking a proactive approach to addressing our core issues:
11 | Page
• Council will focus on fixing the parts of the water network that are in poor condition by repairing known leaks and increasing the number of kilometres of pipes that are renewed.
• The Seaview wastewater treatment plant is nearing the end of its serviceable life, and we need to renew a number of the critical systems at the facility.
• We are looking at ways to manage the increasing demand for water through initiatives such as universal smart meters and building the resilience of our reservoir network.
• Completing the construction of Tupua Horo Nuku (Eastern Bays Shared Path) will provide more protection for the road out to Eastbourne from the ocean and extreme weather events.
• Improving the resilience of our roading infrastructure by finishing the improvements to Eastern Hutt Road and making good progress on a new multi-modal transport corridor connecting Gracefield and State Highway 2 (the Cross Valley Connection project).
• Making progress on the construction of Te Wai Takamori o Te Awa Kairangi (RiverLink) to provide protection from floods and further revitalise our city centre, improving public transport and addressing congestion.
Alongside investment in infrastructure, a priority is to focus on community wellbeing and supporting people to identify and be proud of where they live. This 10 Year Plan shows that we are taking steps to provide flexible, high-quality spaces and places where people can connect and access services and activities, including hubs and libraries, community halls, pools, and other facilities.
Our financial management remains strong, and our Financial Strategy continues to focus on achieving a balanced budget over the long-term. Like many other councils, we know there are financial challenges ahead and that we must continue to act prudently on behalf of ratepayers to balance wellbeing and ratepayer expectations.
A key focus of the 10 Year Plan is taking the next steps in facing the pressures of a growing population, ageing infrastructure and the impacts of a changing climate. We must do this while also striking a balance between planned rates
12 | Page
increases and including funding to progressing key projects and avoiding significant service reductions.
[the following is to be updated after consultation]
With financial sustainability and affordability front of mind Council is proposing an increase of 16.9% (after growth) in the total amount of rates revenue we collect for 2024/25 in order to fund the approved projects. Around 450% of this will go towards investment in infrastructure for water services and the remaining funds will cover costs for all the other services including roading, parks, community facilities, rubbish and recycling.
This rates increase equates on average to $10.83 per week per residential household.
13 | Page
How to read this plan
We have a wide range of responsibilities and provides a variety of services to the community of Te Awa Kairangi ki Tai Lower Hutt. To guide our activities and management of our finances and ratepayers’ money responsibly, we work to detailed plans. This 10 Year Plan is also known as the Long-Term Plan.
This 10-Year Plan is aimed at providing a long-term perspective over Council’s:
• activities and decision making,
• activities Council plans to undertake,
• the cost of delivering these activities and how they will be paid for.
This 10 Year Plan was shaped through a comprehensive process of engagement, planning, consultation, and decision making which will continue through the life of the plan. It outlines Council’s vision for the future and contains plans to achieve that vision over time. It also highlights the challenges and opportunities facing Council and our strategy to meet these over the next 10 years in each activity area.
In addition to setting Council’s direction, this 10 Year Plan sets out the basis for monitoring and evaluation, so we can report to the community on progress.
Here’s a quickrundown of theCouncil planning and reporting cycle:
• The 10 Year Plan sets out the plans for Te Awa Kairangi Lower Hutt over the following decade and outlines key projects and budgets for that period. The first year of the 10 Year Plan also serves as the Annual Plan for that year.
• In the two years following a 10-year plan, Council produces an Annual Plan each year.
In both the 10 Year Plan and Annual Plans we set goals across different activity areas to make sure Council is always striving to best serve the community. In Council’s Annual Report, we compare the goals we set with how we performed that year. This document is then audited by the Office of the Auditor General.
14 | Page
Challenges we are all facing
It’s important to understand the challenges we are facing in this 10 Year Plan. This is one of our most challenging plans due to the growing population, challenging economic environment, changing climate, managing our assets and dealing with past under investment in our water infrastructure. All these factors play a part in how we plan to take the next steps for our city.
Agrowing population
The current population of Te Awa Kairangi ki Tai Lower Hutt is about 113,000. We’re expecting this figure to reach 125,000 by 2033, and 137,000 in 2043. [could show this in a simple graph?] Our population is also ageing. Rates of projected population growth are highest at ages 50 and over, while the share of the population aged over 70 is expected to rise from 11% to 14% over the next 30 years. Population growth of this scale is putting huge pressure on our supply of houses and infrastructure like pipes and roads.
What we’re doing: Council is working in partnership with the Government, community organisations and the private sector to prepare for population growth. We want to deliver a city that is thriving and meets the needs of diverse businesses, residents, and visitors. We are proposing to continue our policy which requires developers of new houses to contribute to the cost of growthrelated infrastructure such as the cost of the pipes and roads to help support our increasing population.
Achallenging economic environment
Since setting our last 10 Year Plan in 2021, circumstances have changed a lot, with many factors creating the new economic environment.
Council knows the community is facing increasing cost burdens that are having a significant impact on day-to-day living. Council is also faced with economic pressures such as high inflation, the higher cost of borrowing due to increased interest rates, increasing insurance costs, and higher construction and resourcing costs. We need to strike the right balance between these cost pressures and the importance of investing in our city’s infrastructure. Simply put, Council is facing much higher costs and the need to balance the budget is essential.
15 | Page
What we’re doing: Council is carefully considering the rating impact on our community who are affected by the rising cost of living. This means reviewing project budgets and working hard to find savings in our operating costs.
Looking after ageing infrastructure
Council is dealing with the consequences of historic underinvestment in our ageing infrastructure. When this is combined with record population growth, higher costs across the board and more frequent severe weather events, it presents us with some key questions to answer. We are also looking closely at providing sustainable transport choices to ease traffic congestion in the city. This means that water services, transport options and our resilience measures are all in the spotlight even more with increasing demand and much higher levels of investment required. We also have a significant deferred work programme which needs to be dealt with in the years beyond this 10 Year Plan. This will be difficult to do with our current funding mechanisms.
What we’re doing: For this 10 Year Plan, we’re taking the next steps with a clear commitment and strong focus on improving infrastructure. Most of our investment is going towards water and transport as well as projects focused on adapting to a changing climate. All this work is essential in building strong foundations for our future.
Weathering thechangein climate
Communities around the country are feeling the impact of more frequent and severe weather events due to the changing climate. With much of our population living on a large flood plain, we know that Te Awa Kairangi ki Tai Lower Hutt is especially susceptible to the risk of flooding and landslides.
What we’re doing: Te Wai Takamori o Te Awa Kairangi (RiverLink) is a major project we are undertaking in partnership with Greater Wellington Regional Council, Mana Whenua and central government. As well as improving flood protection the project will develop better walking, cycling, and public transport connections in central Te Awa Kairangi ki Tai Lower Hutt and help to revitalise our city centre.
Council wants to avoid increasing debt on this project. We’re considering ways to lower costs by reducing some parts of the project and looking at different ways of doing things, as well as Investigating other funding sources.
16 | Page
We’re also exploring extending due dates over the life of the project so we can spread the costs more evenly across a longer period of time, reducing the impact on our balance sheet and our ratepayers.
Managingourassets
Past under-investment in many of our facilities means significant work is required over the next 10 years. One of the financialchallenges we’re facing is the future affordabilityof our community facilities, parksand reserves.
At the same time, there is increasing demand from our growing population for new activities. We must ensure we can continue to meet the needs of communities while not increasing the burden on ratepayers.
What we’re doing: Council has reviewed leases, licenses and hirefees in line with our Revenue and Financing Policyto ensure they reflect the true cost of assets and strike a fairbalancefor users and non-users.
Council also plans to look at when and how buildings and spaces are being used and whether they could provide better service to our community, alongside the existing users.
OurStrategy
Our vision is to make Te Awa Kairangi kiTai Lower Hutt city a place where everyone thrives. To do this, we need a plan to get there. Our plan centres around three key priority areas and four waysto support how we deliver them.
We’re working towards:
• Providing future-fit infrastructure
• Enabling a liveable city and vibrant neighbourhoods
• Supporting and enhancing the environment
We’re taking the next steps: [icons to support each]
• In partnership with our communities
• In a way that isfinancially sustainable
• Taking climate changeinto account
• All while promoting the wellbeing of allpeople
17 | Page
Long term financial planning
Budget savings of almost $35 million have been made and incorporated into this 10 Year Plan. Given the importance of the decisions that needed to be made we’ve been through all our budgets line by line, and looked at each project in detail to be sure that we’re doing everything we can to make savings, reduce costs and make good decisions for the long-term success of Te Awa Kairangi ki Tai Lower Hutt.
Council continues to invest in a programme of work called Go Digital, which will help increase efficiency and keep costs down. Go Digital is modernising our operational systems, the way we work, and how we engage with the Public. As you will see in this document, Council has taken steps to organise some projects differently, been flexible where possible and delayed some of our transport initiatives, such as the strengthening of the Cuba Street Overbridge, and postponed some renewals work until we’re in a better position to start them.
Two factors are central to our planning:
• Ensuring our long-term financial sustainability, and
• Carefully considering rates charges that are as affordable as possible for our community.
All project and investment decisions are based on the financial approach outlined in our Financial and Infrastructure strategies. You can read the full strategies in Section 3 of this 10 Year Plan.
18 | Page
Hereis whereyour rates will bespent over thenext 10 years:

Conclusion
We know all Councils are facing some big challenges in the coming years. If we achieve what we set out to do in this 10 Year Plan, then our infrastructure will have progressed to be fit for purpose and resilient against the impacts of the changing climate, and will meet the needs of a growing population. In addition, our facilities and services will support the wellbeing of the community. We will have taken the right steps in aiming to have a much more resilient and future proofed city and one where people are proud to live in.
19 | Page
To take the next steps
The purpose of a 10 Year Plan is to answer the question, “What will our city look like in 10 years as a result of this 10 Year Plan?” As we have seen, this plan outlines how we are going to take the next steps to make Te Awa Kairangi ki Tai Lower Hutt better by fixing things like roads and pipes, managing urban growth and housing intensification, improving our facilities and services to meet community needs, and building resilience to combat the impact of our changing climate. To help us make decisions and prioritise projects, we have developed a framework that identifies our priorities and focus areas for long-term planning and investment decisions. The priorities are like the building blocks of the plan –everything we do in the plan should fit with at least one of these priorities. These priorities are based on clear direction from the elected members to support a connected, resilient and inclusive city where all people thrive.
The framework is a guide for the work we will do in the next decade. By using this tool, we’re able to ensure our decisions are strategy-led, streamlined, and consistent. If projects don’t align, we are able to ask why – is it an activity that sits outside our priorities? Or is it something that simply isn’t a priority in the next 10 years?
The fundamental principle of our strategic approach is to promotethewellbeing of all people in Te Awa Kairangi ki Tai Lower Hutt, focusing on the social, economic, environmental, and cultural wellbeing of the community. The main priorities are: [icons to illustrate]
What wewill do:
• Providefuture-fit infrastructure: Making sure the city has good quality and future-ready pipes and roads.
• Enable a liveablecity andvibrant neighbourhoods: Prioritising a high quality of life, green spaces, and community places.
• Support and enhancetheenvironment: Working to support and protect the natural environment and biodiversity. And howwewill do it:
• In partnership: Collaborating with different groups, organisations and businesses to achieve our goals.
20 | Page
• With the changing climate in mind: Considering the changing climate in all decisions and actions.
• Being financially sustainable: Managing money responsibly.
The Principle: Promoting the wellbeing of all people
For Te Awa Kairangi ki Tai Lower Hutt to thrive, neighbourhoods and communities need to be safe, connected, healthy, inclusive, and resilient. Neighbourhoods and communities give us a sense of place and purpose. Council’s role is to support and enable neighbourhoods and communities to thrive.
Council works alongside communities to facilitate and support community-led initiatives and find local solutions to local issues. We use community hui listen to the specific issues and work on problems with groups and agencies across the city.
Our contribution to enhancing Māori wellbeing
We remain dedicated to activating Te Tiriti o Waitangi, working to deepen understanding and navigate pathways to implement and apply the articles within Te Awa Kairangi ki Tai Lower Hutt. The Māori population in the city is steadily expanding, underscoring the need for well-defined aspirations and objectives aimed at enhancing health, education, and employment opportunities for Māori.
Tākai Here (Memoranda of Partnership) serve as ongoing guidance on how we should engage in partnerships with mana and integrity. Collaborating with Mana Whenua enhances our capacity to fulfil Council’s commitment to nurturing and supporting all Māori and Mātāwaka residing in Te Awa Kairangi ki Tai Lower Hutt.
Mana Whenua, Mātāwaka, and Marae organise annual events like Te Rā o te Raukura, that actively promote and champion health, wellbeing, and whānau. Council is committed to offering support to ensure the success of these events, as they provide Māori and our wider population with engagement opportunities.
21 | Page
Priority 1: Future-fit infrastructure
Our infrastructure supports Te Awa Kairangi ki Tai Lower Hutt to be a liveable city where all people thrive: the social, economic, and cultural wellbeing of our community is sustained, and the health and safety of people, property and the environment is protected.
We’re facing some big financial challenges as we re-prioritise projects in this 10year plan. To meet all our aspirations we need a financial strategy that allows us to invest in key areas that will get our city moving- and meet the requirements of a growing population. We must get to a more financially sustainable footing. We also need to ensure that growth pays for growth. This means allocating costs and charges where they fall.
With a growing population we also face some significant housing challenges. We are supporting partnerships to build more warm, dry, environmentally friendly, and healthy homes for our people to live in. By prioritising investment in upgrading and building new infrastructure, we are creating a strong foundation for sustainable growth that will help meet our aim of protecting and enhancing our environment. We consider it prudent to invest now, to avoid large costs in the future or seeing our infrastructure falling behind the needs of the growing population.
Priority 2: Enabling a liveable city and vibrant neighbourhoods
Over the next 10 years we want to take the next steps in creating a liveable city that promotes a high quality of life for everyone. Easy access to green spaces and community places is an important part of this. Our neighbourhood hubs are places to gather and connect and are central to creating vibrant communities. A lack of affordable housing stock is an issue, and our inner city has a high proportion of renters which is set to increase further. The city centre does not have dense housing in comparison to other parts of our city and we have little social housing in the centre. We know that the quality of our housing stock is low in some areas (e.g. Epuni and Melling), where some experience more mould and dampness than in other areas. Over half of our city’s dwellings are more than 50 years old.
22 | Page
Making sure all our residents live in thriving neighbourhoods and have access to good quality housing remains a key priority for this 10-Year Plan.
Priority 3: Supporting and enhancing the environment
We want to support our natural environment, enhance biodiversity, and enable our community to connect with natural spaces. To achieve this our strategies and plans highlight the need for reserve management practices that respond to the changing climate, and resilient against storms and flooding.
The Council’s draft District Plan proposes a range of provisions to address stormwater runoff, this includes water-sensitive urban design rainwater storage tanks and greywater systems for all new residential development to both store and allow for the reuse of water. Our Urban Development team is preparing a spatial plan that will provide a strategic vision and guidance for the future development of our city, outlining goals and objectives for sustainable growth.
We realise that we cannot solve our environmental challenges alone. That is why we are partnering with other councils to implement programmes like the Wellington Region Waste Management and Minimisation Plan 2023-2029. This will create pathways for everyone in the region to work together to care for our resources
Through activities like our kerbside rubbish and recycling service and the Silverstream Landfill, we already take a joined-up approach to managing solid waste.
Over the next 10 years, we want to take the next steps in our recycling programme alongside our partner councils to include kerbside waste collection for food and green organics (FOGO). In doing this, we will relieve the pressure on our landfills across the region.
23 | Page
Our finances at a glance
The budget for this 10 Year Plan has been developed to ensure the delivery of the priorities and progress the investment in basic infrastructure.
There are three key challenges which need to be managed:

Alongside these three challenges, there is uncertainty around legislative reforms and potentially higher compliance requirements that need to be catered for through this 10 Year Plan. The guiding principles for the financial strategy include:
• achieving intergenerational equity, by spreading the costs between present and future ratepayers
• prudent borrowing levels
• achieving a balanced operating budget and ensuring that every day costs are paid for from everyday income
• careful consideration of the affordability of rates charges
• delivering services effectively and efficiently
• strengthening the financial position in the long term
• maintaining principleof “growth pays for growth”
Check out the full Financial Strategy. <link>
24 | Page


Councils are limited in the ways they can generate revenue to cover their costs. Rates are our main source of revenue. Water services (38%) and transport (18%) make up more than half of our operating spend. Although savings were applied to budgets through previous plans, high costs and inflation are being identified across all our activities, which are outstripping savings made.
25 | Page
Council revenueand operating spend
The cost of borrowing has also increased significantly and is allocated to service areas where incurred.
Council has agreed to go out to the community on a proposed 16.9% rates revenue increase after growth for the year starting on 1 July 2024. On an averagely priced residential home this would equate to around $10.83 more per week in rates.
Council has noted that this 10-year plan has been one of our most challenging due to the cost-of-living crisis, escalating costs, and the need to invest in our infrastructure after decades of under investment.
Through our plans we need to strike the right balance between the investment needed and the cost impact on people. Fixing our pipes and other water infrastructure is our top priority and driving much of the proposed rates increase set out in this draft 10-year plan.
Savings, spending cuts and revenueopportunities
As part of developing the draft LTP proposals for Council we have needed to complete a savings exercise to ease the burden on our ratepayers. We’ve dialled up some activities (like investment in water infrastructure) and dialled down others which are not considered core or priorities at this time. This means we expect there to be some changes to current activities and service levels. These activities have provided great value to the community, however, in the current environment we need to put our resource and budget into other areas.
We’ve gone through the budget line-by-line to find savings, revenue opportunities and propose spending cuts which have informed the proposals included in the draft plan. These equate to $35M over the next 10 years and these have an ongoing effect to reduce the rating impact on ratepayers.
We’ve applied financial principles to our approach for savings and investment. This includes the principle that growth pays for growth (i.e. allocating costs and charges where they fall).
26 | Page
Savings have been made through withdrawal and delaying of some programmes and reducing some services, together with some increases to fees and charges like parking and leases. Some examples of savings include:
• Disestablish Te Wao clubhouse based in Naenae and shift to delivering this Kaupapa through programming and staff based at Neighbourhood Hubs. Disestablish the Safe
• City Ambassador programme – in the current environment we have made the decision to prioritise funding and resource to CCTV services and other safety initiatives.
• Stopping our funding of Hutt Science – We are working with House of Science to identify other sponsors and sustainable funding for this service.
• Continuing our shift towards more community led activity at our facilities, including sports and activities operating at Walter Nash Centre
• Reducing funding for the E Tu Trust – public art will be funded through other existing mechanisms
• Reducing funding for Matariki – in line with our community-led approach, we will offer funding to third parties to host these events
There are savings in other areas such as Mayor’s Taskforce for Jobs (from Year 2 of LTP), exiting Business Central etc.
We’ll continue to implement efficiencies and look for different ways to increase our income which can reduce the rates burden. Refer to <link> for more information about the savings.
Capital Investment and funding
To address growing demands for core infrastructure assets, Council plans to spend $2.6 billion over the next ten years. 62% of this spend is in water services and 21% on transport. This investment level is a significant increase of $1.2 billion compared to the previous 10 Year Plan in 2021, largely due to the need to support investment in a growing city, address the infrastructure deficit with ageing assets and the impact of significant cost escalations due to a challenging economic environment
This significant capital investment will be funded largely by borrowings with some funding from development contributions and central government.
Wellington Water Ltd and Council have been building capacity and capability over the last few years to improve delivery performance. The significant increase in the capital programme, particularly in water services, carries a level of uncertainty and there are risks associated with this. Any delays to our
27 | Page
programme may result in not meeting planned levels of service which will impact our community or result in greater costs in the long term.

Asset management
Infrastructure deteriorates as it ages, increasing the likelihood of failures and service disruption. These failures increase maintenance, operations and customer service costs. Renewing infrastructure that is reaching, or is at, the end of its life reduces the risk of service interruptions and minimises maintenance costs. We are not able to fully fund renewals of all assets during this 10 year plan due to the significant rates increases that would require. While the focus of this plan is for 10 years, there are significant challenges beyond the period of this plan related to the deferred investment and how this will be funded.
Threewaters – drinking water, stormwater and wastewater
Following advice from Wellington Water Limited, this 10 Year Plan includes a significantly higher capital budget for the maintenance, operations and renewal of water assets. This budget is based on what is affordable, even though we know it is less than half of the 30km per year of pipe renewal rate that Wellington Water recommended. This budget will be used for the most urgent jobs and projects. The budgeted spend is expected to result in improvements to the water network over the 10 years and maintain the current levels of service.
28 | Page
Transport
The Integrated Transport Strategy developed in 2022 identified some challenges for the transport network. This 10 Year Plan takes a step towards addressing some of these issues and is expected to improve the overall condition of the transport network over the 10 years. Funding constraints have also had an impact on the planned investment. Government priorities are not yet finalised and further changes may be required in future plans to reflect these priorities.
Abalanced operating budget – everyday costs arepaid for from everyday income
A guiding principle of Council’s Financial Strategy is the importance of having a balanced operating budget. This means that projected operating revenue over the lifetime of this 10 Year Plan is set at a level that’s sufficient to meet projected operating expenses. This ensures that ratepayers are contributing an appropriate amount towards the cost of the services they receive or are able to access, i.e. ‘everyday costs are paid for from everyday income’. This plan projects deficits until 2028-29 when a balanced operating budget position is expected to be achieved, which effectively means we are borrowing to offset the funding shortfall before then.

29 | Page
The projected operating budget provides a realistic balance between managing the pressures on ratepayers and ensuring Council remains financially sustainable into the future.
Borrowings
In August 2023, the Standard & Poors Global Ratings Agency affirmed Council’s AA credit rating, but adjusted the outlook from stable to negative. This reflects the risks associated with higher borrowings due to increased capital investment. To help fund the cost of infrastructure, Council’s Financial Strategy for the upcoming 10 years reflects increases to other funding sources such as development and financial contributions, higher rates revenue, and fees and charges to help fund the cost of infrastructure. After taking other funding sources into account, increased borrowings are largely funding the capital investment programme. Net debt of $0.3 billion at 30 June 2023 is projected to increase to a peak of just over $1 billion in 2029-30.

The projected debt profile is outlined in the graph also highlights the much higher borrowing levels compared to the Annual Plan 2023-2024. The proposed programme fully utilises the debt headroom capacity available whilst ensuring debt is managed prudently within the limits set. Rates
30 | Page
The graph below outlines the rates revenue increases over the 10-year period in the plan.

The examples below show how a range of properties are affected by the proposed rates increase for 2024/25.
Debt and revenue sources are increasing in this 10 Year Plan, however, the levels of service are still at risk due to cost pressures that may exceed the assumptions around inflation. We are doing everything we can to mitigate the risks.
Check out the full Strategy and project list in our supporting documents <link>
Further information can be found in this 10 Year Plan. See:
31 | Page
Property Category CapitalValue 1July2024 2023-2024 Rates 2024-2025 Rates Change Amount annual Change Amount Weekly Change% Average Residential $815,000 $3,348 $3,911 $563 $10.83 16.8% Average Commercial Central $2,350,000 $19,367 $22,645 $3,278 $63.04 16.9% Average Commercial Suburban $2,418,000 $16,501 $19,325 $2,824 $54.31 17.1% Average Rural (no water or wastewater) $1,247,000 $2,342 $2,696 $354 $6.81 15.1% Utilities $3,262,068 $23,515 $28,311 $4,796 $92.23 20.4%
• Financial Strategy <link>
• Infrastructure Strategy <link>
• Revenue and Financing Policy <link>
• Funding Impact Statement Including Rates<link>
What you said about this 10 Year
Plan
[to be updated following the results of consultation]
32 | Page
Introduction to the Statements of Service Performance Chapter
Taking the next steps (sub header if Gusto need, depending on design)
Welcome to the chapter about Service Performance Reporting in Hutt City Council's 10 Year Plan. Here, we'll illustrate how we make decisions and work towards making our community better in areas like the local economy, the environment, and social and culture activities in Te Awa Kairangi ki Tai Lower Hutt.
We measure our Statement of Service performance through key performance reporting. In 2023, Council undertook a comprehensive review of all Key Performance Indicators (KPIs), resulting in some adjustments that will be explained in this chapter.
The KPIs establish a direct alignment between a performance measurement (what we do) and the outcomes we seek for the city (why we do it).
Developed in collaboration with service delivery managers, these indicators align with Council's strategic priorities and were agreed by our elected members. The KPIs help facilitate performance improvement through regular assessments and are measured on a regular basis. The annual Resident’s Satisfaction Survey plays an important role in monitoring the quality of services and facilities that Council provides.
In 2010, the Government introduced a series of mandatory non-financial performance measures that all local authorities must monitor and report to for their communities. The aim is to enable residents to actively participate in discussions about levels of service for their areas and to lift involvement in the decision-making processes of local authorities.
You can find more information about the mandatory non-financial performance measures here – link.
33 | Page
How to read this Chapter
One of our main jobs at Council is to make decisions that are fair and helpful for both current and future generations who live here now and those who will live here in the future. We carefully pick performance measures that match the goals we have for our services and show how well we're doing.
This involves looking closely at what we do, making sure our service goals match our criteria for success, and getting input from the community when we develop documents such as their 10 Year Plan, the Annual Plan and Resident Satisfaction Surveys.
The performance dashboard at the start of each section gives you a quick look at how well our services are performed. The indicators help us track progress outlined in this 10 Year Plan.
By going through this section with an understanding of how:
• we make decisions,
• follow the rules,
• measure our performance, you should get a good idea of how our Council looks at and shares information about its services.
34 | Page
Introduction to Environmental Wellbeing Section
TeAwa Kairangi ki Tai Lower Hutt Environmental Wellbeing
Ensuring communities have access to quality green spaces and clean, safe waterways is important for enhancing everyone’s health and wellbeing. Green spaces provide areas for physical activity, relaxation, and social interactions, contributing to reduced stress and improved mental wellbeing. Clean waterways not only ensure a safe water supply but also contribute to a healthier ecosystem that supports the diverse flora and fauna we enjoy in the city. In this way, safeguarding the environment is synonymous with safeguarding community health.
Taking the next steps over the next 10 years, our focus will be on making positive changes to keep our freshwater healthy and removing storm and wastewater safely and efficiently. We know there are challenges with using too much water now, so we want to change how we use and manage it. Planned changes in the Government’s Natural Resources Plan will help transform how we utilise water, emphasising less water use, smarter practices, and a promise to keep our freshwater healthy for generations.
Our strategic approach to managing our water infrastructure is outlined in Council’s Infrastructure Strategy contained in this 10 Year Plan. The Infrastructure Strategy tells the story of Council’s stewardship approach to the management of the core infrastructure in Te Awa Kairangi ki Tai Lower Hutt and to meeting the challenges our infrastructure faces.
Some of our other projects outlined in this 10 Year Plan are designed to have positive impacts on our urban environment. For instance, by enabling and encouraging the installation of electric vehicle (EV) charging stations, we are playing a role in growing the necessary infrastructure to encourage greater use of EVs. This, in turn, contributes to reduced air pollution and a cleaner, healthier environment. It exemplifies our commitment to fostering sustainability and wellbeing through targeted initiatives that align with the region’s broader environmental goals.
35 | Page
Environmental Wellbeing
Dashboard
Infographics
Average residential electricity consumption
• January 2023 – 433 kWh (Electricity Authority)
• June 2023 – 720 kWh (Electricity Authority)
New solar and wind renewable energy connections in the Wellington Region from April 2022-31 March 2023
• Sun – 123 (Electricity Authority)
• Wind – 0 (Electricity Authority)
Total number of solar and wind renewable energy connections in the Wellington Region at April 2023
• Sun – 4000 (Electricity Authority)
• Wind – 17 (Electricity Authority)
Residents perceptions of problems (Percentage who agreed with problem2023)
• Traffic congestion – 79% (Quality of life survey)
• Air pollution – 23% (Quality of life survey)
• Noise pollution – 44% (Quality of life survey)
• Water pollution – 64% (Quality of life survey)
36 | Page
Stories for Environmental Wellbeing
Why we are proposing to invest in water meters
We're working with Wellington Water and other Councils across the region towards making sure we have enough water for everyone. Water meters are a key component in helping to manage our water better. They help us use water wisely, reduce risks, and save money. Our goal is to be efficient with our natural water resources. Meters not only track water use but also help create a smarter and more sustainable water supply. Since freshwater is a limited resource, we want to use water wisely to avoid problems and secure a healthy future for our water sources.
Our main aim is to make sure customers have sufficient water, especially during hot summer days, while also keeping costs in check. Sustainability, for us, means using water wisely, making supply systems better, and taking care of rivers and aquifers.
Our journey to water security involves three steps:
• reducing leaks,
• using water wisely,
• getting ready for future needs.
This plan not only helps to save water but also encourages smart water use through metering and helps us better prepare for our water needs throughout the summer. By working on all these things together, we make sure our water supply system is strong, and our water future is positive and sustainable.
Smart meters are one way to help us reach our goal of using water more wisely. They give customers data to manage water use and enable the tracking of leaks faster. Smart meters go beyond just saving money – they help us use water efficiently, fit into smart networks, and move towards a future where our community leads in responsible water use.
37 | Page
New waste plan approved
We have approved a plan to transition our city and the Wellington region over the next six years and beyond to an economy where we process and reuse materials in a sustainable or environmentally friendly way. The Wellington Region Waste Management and Minimisation Plan 2023-2029 creates a pathway for everyone in the region to work together to care for our resources – for less waste and a greater place.
We are joining with the rest of Wellington region’s councils to implement this plan. Some region-wide goals include:
• Ensuring the availability of construction and demolition waste processing and recovery by 2026.
• Providing organic processing systems by 2029.
• Adding five new resource recovery locations to the existing network by 2030.
Our action plan includes measures designed to help the city shift from just managing waste to focusing on reducing, reusing, and recycling. These actions include:
• Assisting local businesses with waste minimisation practices by offering free waste audits, presentations and supporting solutions.
• Supporting the development of regional resource recovery networks to minimise waste. This could include options for managing and processing organic waste, construction and demolition waste, biosolids, materials recovery facilities, and a region-wide resource recovery network.
• Advocating for better waste solutions to central government and other national bodies of influence.
38 | Page
Ngā puna wai | Water supply
Statements of ServicePerformance
What wedo
Ensuring the consistent and secure access to safe drinking water is an important concern for our community. To achieve this, Council’s committed to providing a sustainable, high-quality water supply for both domestic and commercial needs. Our ongoing efforts involve close monitoring of water quality and undertaking necessary maintenance and upgrades to meet the required service standards.
The Greater Wellington Regional Council oversees the extraction, treatment, and bulk water supply to feed the city's water supply system.
Why wedo it
By delivering water that is of high quality and affordable, Council actively contributes to several crucial activities:
• Enhancing the overall health of the community
• Ensuring community safety, particularly through the water supply system's firefighting capabilities
• Supporting industrial and residential development initiatives
Significant negativeeffects and mitigation
Possible adverse impacts encompass the reduction of watercourses (such as rivers and streams) due to water extraction rates and the decline of habitats influenced by the upgrading and replacement of three waters infrastructure. Extraction is carefully regulated to minimise adverse effects to acceptable levels. Our efforts contribute to managing water demand, thus reducing the necessity to seek new water sources
39 | Page
Key Performance Indicators
Watersupply PerformanceMeasure
Wewanttoensureourcommunityhas accessto asafe,clean,reliablewatersupply: The extent to which thewater supply will comply with part 4 of the New Zealand drinking water standards and the drinking water quality assurance rules (bacteria and protozoal compliance criteria)
Number of complaints received about water clarity, taste, odour, pressure, flow and continuity of supply per 1,000 connections.
Wherethelocalauthorityattends acalloutinresponsetoafaultorunplannedinterruptiontoits networkedreticulationsystem,thefollowingmedianresponsetimes aremeasured:
Attendance for urgent callouts: from the time the local authority receives notification to the time service personnel reach the site
Resolution of urgent callouts: from the time the local authority receives notification to the time service personnel confirm resolution of the fault or interruption
Attendance for non-urgent callouts: from the time the local authority receives notification to the time service personnel reach the site
Resolution of non-urgent callouts: from the time the local authority receives notification to the time service personnel confirm resolution of the fault or interruption
Quarterly ≤ 20 working days ≤ 20 working days
Weneedtoensurewehavea sustainablewatersupply forthefuture:
40 | Page
Reporting
frequency Target2024-25 Target2024-34
Quarterly
– 100% Full compliance
100%
Full compliance
–
Quarterly ≤ 20 ≤ 20
satisfaction
supply
Annual ≥ 90% ≥ 90%
Resident
with the water
service they receive
Quarterly ≤ 90 minutes ≤ 90 minutes
Quarterly ≤ 8 hours ≤ 8 hours
Quarterly
72
≤ 72
≤
hours
hours
Average drinking water consumption per resident per day Quarterly
Percentage of real water loss from networked reticulation system1 Quarterly ≤ 20% ≤ 20% Kilometres of renewals for 3 Water infrastructure Quarterly Hold or increase on previous year Hold or increase on previous year
The Council has revised performance targets for select three water measures to align with current service levels and ensure consistency in performance measurement across the region, particularly for councils managed by Wellington Water.
≤ 385 litres ≤ 385 litres
1
Capital Projects Water supply
ProspectiveStatement of ComprehensiveRevenueand Expense
Water supply
41 | Page
–
Capitalprojects WaterSupply 2023/2024 2024/2025 2025/2026 2026/2027 2027/2028 2028/2029 2029/2030 2030/2031 2031/2032 2032/2033 2033/2034 ProjectDescription Forecast Draft Forecast Forecast Forecast Forecast Forecast Forecast Forecast Forecast Forecast $000 $000 $000 $000 $000 $000 $000 $000 $000 $000 $000 Capitalprojectstomeetadditionaldemand NetworkUpgradesWSGrowth 25 103 102 105 107 109 112 114 116 237 1,929 ReservoirUpgradesWSGrowth - - - 19,546 41,693 33,799 6,960 - - -Capitalprojectstoreplaceexistingassets DistributionPipeModelDevelopment 40 - - - - - - - - -ReactiveNetworkRenewals(WS) 3,300 - - - - - - - - -ReactivePumpStationRenewals 275 373 227 115 320 129 696 1,177 79 81 182 ReactiveReservoirRenewals 660 1,988 2,738 193 642 5,575 11,271 11,612 6,504 5,935 16,302 ControlSystemsRenewals(WS) - 52 31 31 32 55 33 34 35 35 36 NetworkRenewalsWaterSupply 22,390 9,022 11,724 10,706 13,209 16,162 17,860 18,239 18,537 18,673 37,980 Capitalprojectstoimprovelevelofservice CriticalPipelinesSeismicUpgrade 20 - - - - - - - - - 1,098 DataCollectionWaterSupply - 1,406 63 65 1,062 1,136 1,560 1,297 1,385 73 75 NetworkUpgrade-WaterSupply 6,103 1,308 177 779 266 1,919 2,034 2,177 2,327 2,487 5,789 ReservoirUpgradesWS 2,840 25 354 281 590 385 298 83 297 57 1,809 WaterResilience - 983 1,210 1,616 1,533 2,660 762 38 38 39 40 UniversalWaterMeters - 1,440 7,048 18,025 23,306 22,615 5,076 - - -35,653 16,701 23,674 51,462 82,759 84,543 46,663 34,770 29,319 27,617 65,239 WATERSUPPLY-PROSPECTIVESTATEMENTOFCOMPREHENSIVEREVENUEANDEXPENSE Fortheyearending30June Forecast Draftbudget Forecast Forecast Forecast Forecast Forecast Forecast Forecast Forecast Forecast 2024 2025 2026 2027 2028 2029 2030 2031 2032 2033 2034 $000 $000 $000 $000 $000 $000 $000 $000 $000 $000 $000 REVENUE Rates - - - - - - - - - -Usercharges 4,716 5,987 6,764 6,988 7,320 7,536 7,779 8,042 8,106 8,338 8,529 Operatingsubsidies - - - - - - - - - -Operatinggrants - - - - - - - - - -Capitalsubsidies - - - - - - - - - -CapitalGrants - - - - - - - - - -Development&financialcontributions 1,163 3,370 4,134 4,413 4,407 4,328 5,056 4,722 4,406 4,245 4,272 Vestedassets 122 127 129 132 135 138 141 144 147 150 153 Interestearned - - - - - - - - - -DividendsfromCCOs - - - - - - - - - -Gain/(loss)ondisposalofassets - - - - - - - - - -Otherrevenue - - - - - - - - - -Totalrevenue 6,001 9,484 11,027 11,533 11,862 12,002 12,976 12,908 12,659 12,733 12,954 EXPENDITURE Employeecosts - - - - - - - - - -Operatingcosts 25,726 34,561 34,952 36,545 38,456 39,493 40,945 42,679 43,252 44,454 45,475 Supportcosts/internalcharges 664 755 776 804 812 827 873 869 889 908 924 Interestexpenditure 1,910 3,332 3,830 5,980 8,720 11,426 13,331 14,164 14,372 14,449 15,630 Depreciation 6,375 8,231 8,966 10,270 12,996 15,811 18,037 20,261 21,472 22,515 25,146 Totalexpenditure 34,675 46,879 48,524 53,599 60,984 67,557 73,186 77,973 79,985 82,326 87,175 SURPLUS/(DEFICIT)BEFORETAX (28,674) (37,395) (37,497) (42,066) (49,122) (55,555) (60,210) (65,065) (67,326) (69,593) (74,221) TOTALCAPITALEXPENDITURE 35,653 16,701 23,675 51,462 82,759 84,543 46,662 34,770 29,318 27,617 65,239 PROSPECTIVEFUNDINGREQUIREMENT RATESFUNDINGREQUIREMENT Surplus/(deficit) (28,674) (37,395) (37,497) (42,066) (49,122) (55,555) (60,210) (65,065) (67,326) (69,593) (74,221) Addcapitalcontributions (1,163) (3,370) (4,134) (4,413) (4,407) (4,328) (5,056) (4,722) (4,406) (4,245) (4,272) Ratefundeddebt/(debtrepayment) 7,342 12,871 7,600 5,472 4,320 832 - - - -Totalratesfundingrequirement (22,495) (27,894) (34,031) (41,007) (49,209) (59,051) (65,266) (69,787) (71,732) (73,838) (78,493) LOANFUNDINGREQUIREMENT Capitaltomeetadditionaldemand (25) (103) (102) (19,650) (41,800) (33,908) (7,072) (114) (116) (237) (1,929) Capitaltoimprovelevelofservice (8,963) (5,163) (8,852) (20,767) (26,756) (28,715) (9,730) (3,594) (4,047) (2,656) (8,810) Capitaltoreplaceexistingassets (26,665) (11,435) (14,721) (11,045) (14,203) (21,920) (29,860) (31,062) (25,155) (24,724) (54,500) Lesscapitalcontributions 1,163 3,370 4,134 4,413 4,407 4,328 5,056 4,722 4,406 4,245 4,272 LessUHCCcapitalcontribution - - - - - - - - - -Lessdepreciation 6,375 8,231 8,966 10,270 12,996 15,811 18,037 20,261 21,472 22,515 25,146 Lessassetsales - - - - - - - - - -Lessratefundeddebtrepayment (7,342) (12,871) (7,600) (5,472) (4,320) (832) - - - -Totalloan(funding)/repayment (35,457) (17,971) (18,175) (42,251) (69,676) (65,236) (23,569) (9,787) (3,440) (857) (35,821) TOTALFUNDINGREQUIREMENT (57,952) (45,865) (52,206) (83,258) (118,885) (124,287) (88,835) (79,574) (75,172) (74,695) (114,314)
Explanations of differences between the10Year Plan 2024-2034 and the equivalent years of theAnnual Plan 2023-24 – Water supply
Revenue – Water supply
Revenue has increased by $43 million largely due to changes to fees for water set to recover higher bulk water costs and changes to the assumed development contributions revenue recovery aligned to the proposed capital programme and Development and Financial Contributions policy.
Expenditure – Water supply
Expenditure has increased by $151 million and is driven by higher operating cost budgets for maintenance and operations as per Wellington Water Limited advice, bulk water cost increases, as well as higher interest and depreciation costs linked to increased capital investment.
Capital – Water supply
Capital expenditure has increased by $166 million based on the higher investment as advised by Wellington Water Limited. Some key changes are cost increases for the reservoirs, partly driven by growth, water meters and additional funding allocated for renewal projects.
42 | Page
Waiparu | Wastewater
Statements of ServicePerformance
What WeDo
Council plays a crucial role in the community's wellbeing by collecting, treating, and responsibly disposing of wastewater. This service supports the growth and development of our city while ensuring the health of our residents and the protection of the environment.
We operate an extensive pipe network, and efficiently manage the flow of household and commercial effluent to the Seaview Wastewater Treatment Plant before the treated effluent is discharged into Cook Strait at the Pencarrow Outfall.
Why WeDo It
By providing a reliable and responsible wastewater solution, we contribute to the development of our community and uphold the highest standards of public health and environmental protection.
This activity aligns with our commitment to fostering a thriving, sustainable city that prioritises the wellbeing of both residents and the natural environment.
Significant negativeeffects and mitigation
The release of odours, overflows, and the deterioration of watercourses due to overflows are potential significant adverse effects. Odor control systems have been installed in sections of the wastewater infrastructure where odour issues have been noted. Reports of odours are monitored via the Council's Request for Service system and reports from the wastewater system maintenance and operations contractor. Areas affected by overflows are gradually being upgraded using a combination of approaches. Upgrading occurs through the asset renewal program, which involves replacing each wastewater pipeline as it reaches the end of its useful life, and the asset development program, which considers long-term demand projections for the wastewater
43 | Page
Key PerformanceIndicators
Wastewater
Itiscriticalourcommunityisnotexposedto anyhealthorenvironmentalrisks associatedwith wastewater.Weprovideasafe,reliable,qualitywastewaternetwork: Dry weather wastewater overflows per 1,000 connections
Wheretheterritorialauthorityattendstosewerageoverflowsresultingfrom ablockageorother faultintheterritorialauthority’sseweragesystem,thefollowingmedianresponsetimes are measured:
from the time the territorial authority receives notification to the time service personnel reach the site
Resolution time: from the time the territorial authority receives notification to the time service personnel confirm resolution of the blockage or other fault
44 | Page
PerformanceMeasure Reporting frequency Target2024-25 Target2024-34
Quarterly ≤ 20 ≤ 20 Number of complaints per 1,000 connections Quarterly ≤ 30 ≤ 30 Resident satisfaction with the wastewater service they receive Annual ≥ 90% ≥ 90%
Quarterly ≤ 90 minutes ≤ 90 minutes
Quarterly ≤ 8 hours ≤ 8 hours Compliance with resource consents measured
the number
Quarterly No enforcement action No enforcement action
Attendance time:
by
of abatement notices, infringement notices, enforcement orders, and convictions from wastewater system.
Capital Projects - Wastewater
ProspectiveStatement of ComprehensiveRevenueand Expense – Wastewater
45 | Page
Capitalprojects Wastewater 2023/2024 2024/2025 2025/2026 2026/2027 2027/2028 2028/2029 2029/2030 2030/2031 2031/2032 2032/2033 2033/2034 ProjectDescription Forecast Draft Forecast Forecast Forecast Forecast Forecast Forecast Forecast Forecast Forecast $000 $000 $000 $000 $000 $000 $000 $000 $000 $000 $000 Capitalprojectstomeetadditionaldemand NetworkRenewalsWWGrowth - 103 102 192 1,062 1,515 3,807 114 116 118 753 NetworkUpgradesWWGrowth 100 7,248 307 739 2,133 5,614 8,340 6,817 - - 1,277 TrunkMainOutfallPipelineOverflowMitigationWWGrowth - - - - - - - - - - 4,040 WastewaterValleyFloorInfrastructureGrowth 2,728 9,873 22,217 3,481 - - - - - -PumpStationUpgradesWWGrowth - - - 518 2,647 541 - - - - 1,579 Capitalprojectstoreplaceexistingassets WastewaterModelling 150 - - - - - - - - -NetworkRenewals(WW) 19,621 10,604 3,663 5,925 4,043 4,132 4,218 4,303 4,389 4,472 45,575 PumpStationUpgrades(WW) 300 68 77 2,258 3,051 5,469 1,094 156 791 684 612 TrunkNon-DBOMinorWorks 1,000 - - - - - - - - -TrunkDBOAssetReplacementFund 6,850 33,604 73,500 61,935 26,945 46,295 44,110 55,232 68,170 124,740 9,765 TrunkDBONetworkCyclicReplacement 6,100 - - - - - - - - -TrunkResourceConsentRenewals 740 - - - 1,337 2,022 3,013 797 - -Capitalprojectstoimprovelevelofservice NetworkUpgrades(WW) 568 1,365 1,288 2,342 1,714 1,572 1,640 11,120 11,540 11,431 21,638 TrunkMainOutfallPipelineOverflowMitigation 1,900 1,058 503 134 104 994 1,786 2,846 4,064 1,420 3,617 TrunkTypeAAssetDevelopment 2,169 - - - - - - - - -42,226 63,924 101,657 77,524 43,036 68,155 68,009 81,386 89,069 142,866 88,857 WASTEWATER-PROSPECTIVESTATEMENTOFCOMPREHENSIVEREVENUEANDEXPENSE Fortheyearending30June Forecast Draftbudget Forecast Forecast Forecast Forecast Forecast Forecast Forecast Forecast Forecast 2024 2025 2026 2027 2028 2029 2030 2031 2032 2033 2034 $000 $000 $000 $000 $000 $000 $000 $000 $000 $000 $000 REVENUE Rates - - - - - - - - - -Usercharges 1,207 1,248 1,276 1,305 1,335 1,364 1,393 1,421 1,449 1,477 1,505 Operatingsubsidies 3,234 3,971 4,094 4,211 4,300 4,427 4,550 4,483 4,573 4,660 4,751 Operatinggrants - - - - - - - - - -Capitalsubsidies - - - - - - - - - -CapitalGrants - - - - - - - - - -Development&financialcontributions 775 3,615 4,656 5,351 5,664 5,828 7,100 6,940 6,739 6,603 6,651 Vestedassets 122 127 129 132 135 138 141 144 147 150 153 Interestearned - - - - - - - - - -DividendsfromCCOs - - - - - - - - - -Gain/(loss)ondisposalofassets - - - - - - - - - -Otherrevenue - - - - - - - - - -Totalrevenue 5,338 8,961 10,155 10,999 11,434 11,757 13,184 12,988 12,908 12,890 13,060 EXPENDITURE Employeecosts - - - - - - - - - -Operatingcosts 20,147 22,944 23,891 24,483 25,372 26,167 26,594 26,750 27,364 27,973 28,685 Supportcosts/internalcharges 1,098 1,333 1,370 1,415 1,433 1,461 1,530 1,530 1,566 1,599 1,627 Interestexpenditure 2,430 5,035 7,203 9,652 10,368 11,309 13,031 14,554 15,747 18,570 19,411 Depreciation 11,739 14,182 17,129 20,414 23,778 25,884 28,343 32,499 35,592 39,838 46,059 Totalexpenditure 35,414 43,494 49,593 55,964 60,951 64,821 69,498 75,333 80,269 87,980 95,782 SURPLUS/(DEFICIT)BEFORETAX (30,076) (34,533) (39,438) (44,965) (49,517) (53,064) (56,314) (62,345) (67,361) (75,090) (82,722) TOTALCAPITALEXPENDITURE 42,226 63,924 101,657 77,523 43,036 68,154 68,009 81,386 89,069 142,865 88,858 PROSPECTIVEFUNDINGREQUIREMENT RATESFUNDINGREQUIREMENT Surplus/(deficit) (30,076) (34,533) (39,438) (44,965) (49,517) (53,064) (56,314) (62,345) (67,361) (75,090) (82,722) Addcapitalcontributions (775) (3,615) (4,656) (5,351) (5,664) (5,828) (7,100) (6,940) (6,739) (6,603) (6,651) Ratefundeddebt/(debtrepayment) 5,012 7,606 7,994 7,645 6,110 2,460 - - - -Totalratesfundingrequirement (25,839) (30,542) (36,100) (42,671) (49,071) (56,432) (63,414) (69,285) (74,100) (81,693) (89,373) LOANFUNDINGREQUIREMENT Capitaltomeetadditionaldemand (2,828) (17,225) (22,626) (4,930) (5,842) (7,670) (12,147) (6,931) (116) (118) (7,650) Capitaltoimprovelevelofservice (4,637) (2,423) (1,791) (2,475) (1,818) (2,566) (3,426) (13,966) (15,604) (12,851) (25,255) Capitaltoreplaceexistingassets (34,761) (44,276) (77,240) (70,118) (35,376) (57,918) (52,436) (60,489) (73,349) (129,896) (55,953) Lesscapitalcontributions 775 3,615 4,656 5,351 5,664 5,828 7,100 6,940 6,739 6,603 6,651 LessUHCCcapitalcontribution 7,958 10,399 22,201 18,621 8,516 14,793 14,673 17,663 21,670 37,848 5,227 Lessdepreciation 11,739 14,182 17,129 20,414 23,778 25,884 28,343 32,499 35,592 39,838 46,059 Lessassetsales - - - - - - - - - -Lessratefundeddebtrepayment (5,012) (7,606) (7,994) (7,645) (6,110) (2,460) - - - -Totalloan(funding)/repayment (26,766) (43,334) (65,665) (40,782) (11,188) (24,109) (17,893) (24,284) (25,068) (58,576) (30,921) TOTALFUNDINGREQUIREMENT (52,605) (73,876) (101,765) (83,453) (60,259) (80,541) (81,307) (93,569) (99,168) (140,269) (120,294)
Explanations of differences between the10-year plan 2024-2034 and the equivalent years of theAnnual Plan 2023-24 - Wastewater
Revenue - Wastewater
Revenue has increased by $36 million largely due to changes to operating subsidy from Upper Hutt City Council for the higher costs of shared services for the activity, and changes to the assumed development contributions recovery aligned to the proposed capital programme and Development and Financial Contributions policy.
Expenditure- Wastewater
Expenditure has increased by $127 million and is driven by higher operating cost budgets for maintenance and operations as advised by Wellington Water Limited as well as higher interest and depreciation costs linked to the increased capital investment.
Capital - Wastewater
Capital expenditure has increased by $347 million based on the higher investment as advised by Wellington Water Limited. Some key changes are to the timing and costs for the Seaview Wastewater Treatment Plant, cost increases for the Petone Collecting sewer upgrade and additional funding allocated for other renewal projects.
46 | Page
Waiāwhā | Stormwater
Statements of Service Performance
What wedo
Everyone is feeling the effects of a changing climate. Council is focussed on controlling stormwater to keep people safe and minimise property damage during extreme weather events.
Through the provision of a comprehensive stormwater drainage pipe network, we effectively manage surface water run-off, offering flood protection and control.
Why wedo it
Controlling stormwater is an important step in safeguarding the wellbeing of the community. Council’s objective is to create a resilient and safe environment by managing stormwater effectively.
By doing this, we also protect people, property and the environment, while managing costs responsibly for the benefit of the community.
Significant negativeeffects and mitigation
The release of pollutants into watercourses via stormwater and flooding when the stormwater system exceeds capacity are potentially significant adverse impacts. To mitigate these, pollution prevention programs, road cleaning initiatives, and debris pits installed in most stormwater system inlets help reduce the entry of contaminants, supported by our monitoring efforts. The stormwater system is engineered to standards commensurate with risk levels at various locations, comparable to those in other New Zealand cities. Additionally, we collaborate with the Greater Wellington Regional Council regarding flooding issues related to watercourses under their management.
47 | Page
Key PerformanceIndicators
Stormwater
Wewanttoensureourcommunitycanenjoyrecreationalassets: Achieve water quality at main recreational beaches: percentage of days that monitored beaches are suitable for recreational use during bathing season – 1 December to 31 March
WewanttoensureourCityhas asafe,reliable,qualitystormwatersystem:
flooding events
Median response time to attend a flooding event, measured from the time the territorial authority receives notification to the time service personnel reach the site
Compliance with resource consents for discharges from stormwater system (number of abatement notices, infringement notices, enforcement orders, and convictions
48 | Page
PerformanceMeasure Reporting frequency Target2024-25 Target2024-34
Annual 100% 100%
Number
Quarterly ≤ 2 ≤ 2 Number of habitable
Quarterly ≤ 0.24 ≤ 0.24 Number of complaints
Quarterly ≤ 20 ≤ 20
of flooding events (where stormwater enters a habitable floor)
floors affected by
(per 1,000 connections)
about stormwater system performance (per 1,000 connections)
Quarterly ≤ 8 hours ≤ 8 hours Resident satisfaction with
Annual ≥ 70% ≥ 70%
Quarterly Full compliance (0 notices) Full compliance
notices)
the city’s stormwater system
(0
Capital Projects - Stormwater
ProspectiveStatement of ComprehensiveRevenueand Expense
49 | Page
– Stormwater Capitalprojects Stormwater 2023/2024 2024/2025 2025/2026 2026/2027 2027/2028 2028/2029 2029/2030 2030/2031 2031/2032 2032/2033 2033/2034 ProjectDescription Forecast Draft Forecast Forecast Forecast Forecast Forecast Forecast Forecast Forecast Forecast $000 $000 $000 $000 $000 $000 $000 $000 $000 $000 $000 Capitalprojectstomeetadditionaldemand BeachStormwaterOutletsSWGrowth - 1,210 2,964 314 107 109 112 114 116 118 121 NetworkUpgradesSWGrowth 100 1,034 818 470 778 5,138 5,801 9,073 9,254 5,916 1,206 StormwaterValleyFloorInfrastructureGrowth 6,020 20,132 48,010 44,549 16,856 - - - - -Capitalprojectstoreplaceexistingassets ControlSystemsrenewals(SW) - 21 10 10 11 11 22 11 12 12 24 StormwaterNetworkModelling 300 - - - - - - - - -NetworkRenewals-(SW) 5,665 3,769 820 915 1,109 1,445 6,033 1,693 2,012 2,409 2,906 PumpStationReactiveRenewals(SW) 410 413 6,999 103 1,391 1,393 3,290 2,670 433 3,088 129 Capitalprojectstoimprovelevelofservice BeachStormwaterOutlets - - - 5 - - - - - -DowseDriveStormwaterImprovement - 31 - - - - - - - -NetworkUpgrades(SW) 220 744 4,126 3,456 2,306 4,266 13,334 18,227 18,823 21,819 25,441 PumpStationUpgrades(SW) - - - 114 22 115 - - - -Stormwaterconsentingproject 354 517 511 523 - - - - - -13,069 27,871 64,258 50,460 22,580 12,477 28,592 31,788 30,650 33,362 29,827 STORMWATER-PROSPECTIVESTATEMENTOFCOMPREHENSIVEREVENUEANDEXPENSE Fortheyearending30June Forecast Draftbudget Forecast Forecast Forecast Forecast Forecast Forecast Forecast Forecast Forecast 2024 2025 2026 2027 2028 2029 2030 2031 2032 2033 2034 $000 $000 $000 $000 $000 $000 $000 $000 $000 $000 $000 REVENUE Rates - - - - - - - - - -Usercharges 12 13 13 13 14 14 14 15 15 15 15 Operatingsubsidies 9 9 9 10 10 10 10 11 11 11 11 Operatinggrants - - - - - - - - - -Capitalsubsidies - - - - - - - - - -CapitalGrants 3,010 13,099 36,317 33,732 12,742 - - - - -Development&financialcontributions 119 1,114 1,535 1,943 2,177 2,314 2,906 2,949 2,945 2,905 2,921 Vestedassets 122 127 129 132 135 138 141 144 147 150 153 Interestearned - - - - - - - - - -DividendsfromCCOs - - - - - - - - - -Gain/(loss)ondisposalofassets - - - - - - - - - -Otherrevenue - - - - - - - - - -Totalrevenue 3,272 14,362 38,003 35,830 15,078 2,476 3,071 3,119 3,118 3,081 3,100 EXPENDITURE Employeecosts - - - - - - - - - -Operatingcosts 6,223 7,117 7,381 7,700 8,056 8,290 8,573 8,924 9,144 9,371 9,677 Supportcosts/internalcharges 384 587 603 624 631 642 677 675 690 704 717 Interestexpenditure 681 1,351 2,106 2,719 2,710 2,770 3,733 4,609 5,167 5,716 5,710 Depreciation 5,608 6,464 7,376 8,504 9,588 9,945 10,385 11,508 12,109 12,730 13,944 Totalexpenditure 12,896 15,519 17,466 19,547 20,985 21,647 23,368 25,716 27,110 28,521 30,048 SURPLUS/(DEFICIT)BEFORETAX (9,624) (1,157) 20,537 16,283 (5,907) (19,171) (20,297) (22,597) (23,992) (25,440) (26,948) TOTALCAPITALEXPENDITURE 13,069 27,871 64,258 50,460 22,581 12,477 28,593 31,788 30,650 33,362 29,826 PROSPECTIVEFUNDINGREQUIREMENT RATESFUNDINGREQUIREMENT Surplus/(deficit) (9,624) (1,157) 20,537 16,283 (5,907) (19,171) (20,297) (22,597) (23,992) (25,440) (26,948) Addcapitalcontributions (3,129) (14,213) (37,852) (35,675) (14,919) (2,314) (2,906) (2,949) (2,945) (2,905) (2,921) Ratefundeddebt/(debtrepayment) - - - - - - - - - -Totalratesfundingrequirement (12,753) (15,370) (17,315) (19,392) (20,826) (21,485) (23,203) (25,546) (26,937) (28,345) (29,869) LOANFUNDINGREQUIREMENT Capitaltomeetadditionaldemand (6,120) (22,376) (51,792) (45,333) (17,741) (5,247) (5,913) (9,187) (9,370) (6,034) (1,326) Capitaltoimprovelevelofservice (574) (1,292) (4,637) (4,098) (2,329) (4,381) (13,334) (18,227) (18,823) (21,819) (25,441) Capitaltoreplaceexistingassets (6,375) (4,203) (7,829) (1,029) (2,511) (2,849) (9,346) (4,374) (2,457) (5,509) (3,059) Lesscapitalcontributions 3,129 14,213 37,852 35,675 14,919 2,314 2,906 2,949 2,945 2,905 2,921 LessUHCCcapitalcontribution - - - - - - - - - -Lessdepreciation 5,608 6,464 7,376 8,504 9,588 9,945 10,385 11,508 12,109 12,730 13,944 Lessassetsales - - - - - - - - - -Lessratefundeddebtrepayment - - - - - - - - - -Totalloan(funding)/repayment (4,332) (7,194) (19,030) (6,281) 1,926 (218) (15,302) (17,331) (15,596) (17,727) (12,961) TOTALFUNDINGREQUIREMENT (17,085) (22,564) (36,345) (25,673) (18,900) (21,703) (38,505) (42,877) (42,533) (46,072) (42,830)
Explanations of differences between the10Year Plan 2024-2034 and the equivalent years of theAnnual Plan 2023-24 - Stormwater
Revenue - Stormwater
Revenue has increased by $19 million largely due to changes to the assumed development contributions recovery aligned to the proposed capital programme and Development and Financial Contributions policy.
Expenditure- Stormwater
Expenditure has increased by $28 million and is driven by higher operating cost budgets for maintenance and operations as per Wellington Water Limited advice as well as higher interest and depreciation costs linked to the increased capital investment.
Capital - Stormwater
Capital expenditure has increased by $113 million based on the higher investment as advised by Wellington Water Limited. Some key changes are to funding allocations for projects to deal with flooding (partly driven by growth), as well as additional allocations for renewal projects.
50 | Page
Para | Solid waste
Statements of ServicePerformance
What wedo
Council’s role in solid waste management is important for keeping the community healthy, ensuring a high-quality of life, and supporting a thriving environment.
The solid waste activity delivers on Council’s waste management objectives, by:
• operating Council’s kerbside rubbish, recycling and green waste collection service;
• operating Silverstream landfill;
• monitoring and managing all of Council’s closed landfills; and
• investigating, trialling and/or implementing new initiatives to reduce waste.
Over the next 10 years, Council is working to improve our waste minimisation by partnering with other councils in the region to implement a Food and Green Organic collection service.
Why wedo it
Solid waste management is integral to maintaining a healthy, vibrant community. By actively participating in waste management, we directly contribute to the overall wellbeing of our residents and the preservation of the environment.
Our commitment to waste minimisation reflects our dedication to creating a sustainable and eco-friendly community. Through the ownership and operation of the Silverstream Landfill, we take a comprehensive approach to managing solid waste.
Significant negativeeffects and mitigation
The potential environmental impacts resulting from non-compliance with resource consent conditions are managed through our management strategies and adherence to best practices. Inadequate recycling and refuse collection
51 | Page
services might result in increased littering. While certain sustainability initiatives, like waste reduction and modern waste management practices, may appear costly, time consuming, and restrictive to some, these effects are alleviated by collaborating with communities to establish mutually agreed upon sustainability approaches.
Key PerformanceIndicators
Weareworkingtominimisetheharmfuleffectsofrefuse:
notices received from Greater Wellington Regional Council
Wewanttoreducelitterandthenegativeimpactsitcanhaveonournaturalenvironmentandon ourcommunity’shealth:
Wearelookingatwaystoreducetheamountofwastegoingtolandfill:
52 | Page
PerformanceMeasure Reporting frequency Target2024-25
Solidwaste
Target2024-34
Number of resource consent-related
Quarterly
compliance
Full compliance (0 notices)
infringement
Full
(0 notices)
Number of illegal dumping complaints Quarterly Previous year
10% Previous year
10%
less
less
Tonnes of kerbside waste
landfill (tonnes per person) Quarterly
previous year Less
previous year Percentage of kerbside recycling that is contaminated and diverted to landfill Quarterly ≤10% ≤10% Tonnes of kerbside recycling collected Quarterly Previous year plus ≥2% Previous year plus ≥2% Overall resident satisfaction with Council’s Rubbish and Recycling services Annual ≥85% ≥85% Capital Projects - Solid waste Capitalprojects SolidWaste 2023/2024 2024/2025 2025/2026 2026/2027 2027/2028 2028/2029 2029/2030 2030/2031 2031/2032 2032/2033 2033/2034 ProjectDescription Forecast Draft Forecast Forecast Forecast Forecast Forecast Forecast Forecast Forecast Forecast $000 $000 $000 $000 $000 $000 $000 $000 $000 $000 $000 Capitalprojectstoimprovelevelofservice SilverstreamLFStg2Design&Const 6,970 8,510 8,772 4,672 2,151 4,190 3,519 4,507 411 3,928 328 SilverstreamLandfillAsbestosCell 2,494 - - - 1,746 - - - - -FoodandGreenWaste - - 1,023 7,519 5,024 - - - - -SilverstreamLandfillEVChargingStation 800 1,540 - - - - - - - -10,264 10,049 9,795 12,191 8,922 4,190 3,519 4,507 411 3,928 328
to
Less than
than
ProspectiveStatement of ComprehensiveRevenueand Expense - Solid waste
Explanationsof differences between the 10 YearPlan 2024-2034 and the equivalent years of the Annual Plan 2023-24 - Solidwaste
Revenue - Solidwaste
Revenue has decreased by $9 million largely due to anticipated waste diversion activities at the Silverstream Landfill which is expected to reduce the volume of waste received in the future.
Expenditure - Solidwaste
Expenditure has increased by $43 million, driven by higher operating cost budgets for the kerbside collection services including introduction of the new Food and Green Organics collection service proposed to start 1 July 2027. This is offset by higher targeted rates funding included under the Corporate Services activity.
53 | Page
SOLIDWASTE-PROSPECTIVESTATEMENTOFCOMPREHENSIVEREVENUEANDEXPENSE Fortheyearending30June Forecast Draftbudget Forecast Forecast Forecast Forecast Forecast Forecast Forecast Forecast Forecast 2024 2025 2026 2027 2028 2029 2030 2031 2032 2033 2034 $000 $000 $000 $000 $000 $000 $000 $000 $000 $000 $000 REVENUE Rates - - - - - - - - - -Usercharges 30,698 35,075 37,157 38,463 39,730 40,958 42,150 43,309 44,419 45,490 46,549 Operatingsubsidies - - - - - - - - - -Operatinggrants - - - - - - - - - -Capitalsubsidies - - - - - - - - - -CapitalGrants - 500 - 2,500 - - - - - -Development&financialcontributions - - - - - - - - - -Vestedassets - - - - - - - - - -Interestearned - - - - - - - - - -DividendsfromCCOs - - - - - - - - - -Gain/(loss)ondisposalofassets - - - - - - - - - -Otherrevenue - 30 31 31 32 33 33 34 35 35 36 Totalrevenue 30,698 35,605 37,188 40,994 39,762 40,991 42,183 43,343 44,454 45,525 46,585 EXPENDITURE Employeecosts 254 328 340 352 360 369 379 388 398 408 418 Operatingcosts 28,184 31,756 32,302 31,813 38,106 38,698 39,275 39,847 40,432 41,027 41,631 Supportcosts/internalcharges 958 1,197 1,252 1,285 1,312 1,339 1,402 1,390 1,426 1,456 1,494 Interestexpenditure 483 390 394 408 419 427 434 444 454 460 466 Depreciation 1,533 2,091 2,311 2,473 2,563 2,661 2,751 2,846 2,902 2,954 2,999 Totalexpenditure 31,412 35,762 36,599 36,331 42,760 43,494 44,241 44,915 45,612 46,305 47,008 SURPLUS/(DEFICIT)BEFORETAX (714) (157) 589 4,663 (2,998) (2,503) (2,058) (1,572) (1,158) (780) (423) TOTALCAPITALEXPENDITURE 10,264 10,049 9,795 12,191 8,922 4,190 3,519 4,507 411 3,928 328 PROSPECTIVEFUNDINGREQUIREMENT RATESFUNDINGREQUIREMENT Surplus/(deficit) (714) (157) 589 4,663 (2,998) (2,503) (2,058) (1,572) (1,158) (780) (423) Addcapitalcontributions - (500) - (2,500) - - - - - -Ratefundeddebt/(debtrepayment) (11,490) (12,639) (14,317) (16,202) (16,413) (17,400) (18,334) (19,304) (20,207) (21,070) (21,911) Totalratesfundingrequirement (12,204) (13,296) (13,728) (14,039) (19,411) (19,903) (20,392) (20,876) (21,365) (21,850) (22,334) LOANFUNDINGREQUIREMENT Capitaltomeetadditionaldemand - - - - - - - - - -Capitaltoimprovelevelofservice (10,264) (10,049) (9,795) (12,191) (8,922) (4,190) (3,519) (4,507) (411) (3,928) (328) Capitaltoreplaceexistingassets - - - - - - - - - -Lesscapitalcontributions - 500 - 2,500 - - - - - -LessUHCCcapitalcontribution - - - - - - - - - -Lessdepreciation 1,533 2,091 2,311 2,473 2,563 2,661 2,751 2,846 2,902 2,954 2,999 Lessassetsales - - - - - - - - - -Lessratefundeddebtrepayment 11,490 12,639 14,317 16,202 16,413 17,400 18,334 19,304 20,207 21,070 21,911 Totalloan(funding)/repayment 2,759 5,181 6,833 8,984 10,054 15,871 17,566 17,643 22,698 20,096 24,582 TOTALFUNDINGREQUIREMENT (9,445) (8,115) (6,895) (5,055) (9,357) (4,032) (2,826) (3,233) 1,333 (1,754) 2,248
Capital - Solidwaste
Capital expenditure has increased by $15 million based on the roll out costs and joint investment into a processing plant for the new Food and Green Organics collection service proposed to start 1 July 2027.
54 | Page
Whakauka me te Manawaroa |
Sustainability and resilience
Statements of ServicePerformance
What wedo
The climate change and sustainability activity is focused on changing the way we do things to improve climate outcomes across Council and for the community. This includes delivering on our Carbon Reduction Plan 2021-31 and the Lower Hutt Climate Action Pathway.
The climate change activity delivers on Council’s climate change objectives, by:
• providing advice to Council on climate change-related projects (such as the setting up of a Green Star requirement for the new Naenae pool);
• managing and supporting projects to implement carbon reductions in line with Council’s Carbon Reduction Plan 2021-31 and the Lower Hutt Climate Action Pathway (such as the EV charging station roll out);
• delivering the Low Carbon Acceleration fund to support the city to reduce its emissions faster;
• managing and supporting regional projects, in collaboration with neighbouring Councils (including the Regional Climate Change Impact and Risk Assessment, Regional Adaptation Plan and Regional Emissions Reduction Plan; and
• monitoring Council’s carbon emissions (annual carbon footprint).
Why wedo it
In order for Council’s climate change actions to be meaningful, the Council, and communities in Te Awa Kairangi ki Tai Lower Hutt, must ultimately align with good practice.
The sustainability and resilience activities enable the delivery of emission reductions, in line with Council’s organisational zero by 2050 carbon target.
55 | Page
Significant negativeeffects and mitigation
Emergency response and recovery efforts can temporarily impact community and environmental well-being as social systems and infrastructure are reconstructed after an emergency. A poorly executed emergency management response can lead to severe and lasting negative effects on overall well-being.
Key PerformanceIndicators
Sustainabilityandresilience
PerformanceMeasure Reporting frequency Target2024-25 Target2024-34
Councilisrespondingtotheimpactofchangeinclimateand contributingtothegoalof acarbon zerocityby2050
Emissions from Councilowned facilities (tCO2-e)
Emissions from Councilowned fossil fuel vehicles (tCO2-e)
Quarterly 30% reduction by 2024 50% reduction by 2030
Quarterly 30% reduction by 2024 Zero emissions by 2030
Ourcityispreparedforanemergencyandcanrespondappropriately: EOC resourcing levels maintained at least at WREMO competency level targets:
Annual Advanced - 6, Intermediate - 12 Foundation - 12
There are no capital projects associated with this activity.
Controller -6 Advanced - 18, Intermediate - 16 Foundation - 50
56 | Page
Operating projects over $250kper year - Sustainability and resilience Capital Projects Sustainability and resilience - Sustainability and resilience
Sustainability &Resilience 2023/2024 2024/2025 2025/2026 2026/2027 2027/2028 2028/2029 2029/2030 2030/2031 2031/2032 2032/2033 2033/2034 Project Forecast Draft Budget Forecast Forecast Forecast Forecast Forecast Forecast Forecast Forecast Forecast Description $000 $000 $000 $000 $000 $000 $000 $000 $000 $000 $000 WasteMinimisationProjects 1,140 1,600 1,635 1,673 1,711 1,749 1,786 1,821 1,858 1,893 1,929 Total 1,140 1,600 1,635 1,673 1,711 1,749 1,786 1,821 1,858 1,893 1,929 Operating projects
ProspectiveStatement of ComprehensiveRevenueand ExpenseSustainability and resilience
Explanations of differences between the10-year plan 2024-2034 and the equivalent years of the Annual Plan 2023-24 - Sustainability and resilience
Revenue - Sustainability and resilience
Revenue has increased by $5 million largely due to the waste minimisation levy recovery based on assumed volume of waste.
Expenditure- Sustainability and resilience
Expenditure has increased by $10 million. This is partly linked to the higher waste minimisation levy which is ringfenced and allocated to specific activities in alignment with the Waste Management and Minimisation Plan. There is also additional budget allocated through this plan for emergency management activities, a large portion of which is contracted costs.
57 | Page
SUSTAINABILITY&RESLIENCE-PROSPECTIVESTATEMENTOFCOMPREHENSIVEREVENUEANDEXPENSE Fortheyearending30June Forecast Draftbudget Forecast Forecast Forecast Forecast Forecast Forecast Forecast Forecast Forecast 2024 2025 2026 2027 2028 2029 2030 2031 2032 2033 2034 $000 $000 $000 $000 $000 $000 $000 $000 $000 $000 $000 REVENUE Rates - - - - - - - - - -Usercharges 118 122 152 190 234 239 244 249 254 259 263 Operatingsubsidies - - - - - - - - - -Operatinggrants - - - - - - - - - -Capitalsubsidies - - - - - - - - - -CapitalGrants 255 - - - - - - - - -Development&financialcontributions - - - - - - - - - -Vestedassets - - - - - - - - - -Interestearned - - - - - - - - - -DividendsfromCCOs - - - - - - - - - -Gain/(loss)ondisposalofassets - - - - - - - - - -Otherrevenue 1,984 2,191 2,239 2,291 2,344 2,395 2,445 2,494 2,544 2,593 2,642 Totalrevenue 2,357 2,313 2,391 2,481 2,578 2,634 2,689 2,743 2,798 2,852 2,905 EXPENDITURE Employeecosts 936 977 1,011 1,046 1,072 1,099 1,127 1,155 1,184 1,213 1,131 Operatingcosts 2,131 3,052 3,106 3,170 3,267 3,324 3,394 3,463 3,532 3,599 3,668 Supportcosts/internalcharges 539 789 798 816 835 864 898 906 916 946 979 Interestexpenditure 121 185 191 226 249 252 260 254 229 196 142 Depreciation 34 114 114 114 114 112 111 112 111 45 15 Totalexpenditure 3,761 5,117 5,220 5,372 5,537 5,651 5,790 5,890 5,972 5,999 5,935 SURPLUS/(DEFICIT)BEFORETAX (1,404) (2,804) (2,829) (2,891) (2,959) (3,017) (3,101) (3,147) (3,174) (3,147) (3,030) TOTALCAPITALEXPENDITURE 291 - - - - - - - - -PROSPECTIVEFUNDINGREQUIREMENT RATESFUNDINGREQUIREMENT Surplus/(deficit) (1,404) (2,804) (2,829) (2,891) (2,959) (3,017) (3,101) (3,147) (3,174) (3,147) (3,030) Addcapitalcontributions (255) - - - - - - - - -Ratefundeddebt/(debtrepayment) - - - - - - - - - -Totalratesfundingrequirement (1,659) (2,804) (2,829) (2,891) (2,959) (3,017) (3,101) (3,147) (3,174) (3,147) (3,030) LOANFUNDINGREQUIREMENT Capitaltomeetadditionaldemand - - - - - - - - - -Capitaltoimprovelevelofservice (250) - - - - - - - - -Capitaltoreplaceexistingassets (41) - - - - - - - - -Lesscapitalcontributions 255 - - - - - - - - -LessUHCCcapitalcontribution - - - - - - - - - -Lessdepreciation 34 114 114 114 114 112 111 112 111 45 15 Lessassetsales - - - - - - - - - -Lessratefundeddebtrepayment - - - - - - - - - -Totalloan(funding)/repayment (2) 114 114 114 114 112 111 112 111 45 15 TOTALFUNDINGREQUIREMENT (1,661) (2,690) (2,715) (2,777) (2,845) (2,905) (2,990) (3,035) (3,063) (3,102) (3,015)
Ngā Ratonga Waeture | Regulatory services
Statements of ServicePerformance
What wedo
Our statutory activities are essential for cultivating a clean, healthy, appealing, safe, and sustainable environment for residents and visitors. These activities encompass building and resource consents, environmental health, trade waste management, animal services, and parking control. We are currently implementing new systems and processes to improve the customer experience and speed of our consent processing. For example, our new customer portal “Objective Build” and new processing software “Go Get” will help streamline consenting processes in the future.
We ensure the safety of the community by inspecting various establishments to guarantee cleanliness and hygienic practices. This reduces the risk of foodborne illnesses and alcohol-related harm.
Additionally, we oversee health-related activities in industries such as tattoo studios and beauty therapy shops to mitigate potential health hazards.
We also address health nuisances and noise issues to maintain a healthy living environment for everyone.
Why wedo it
Most of our functions are required through various pieces of legislation. While primarily focused on environmental wellbeing, these activities also contribute directly to economic, social, and community safety outcomes. They play a crucial role in establishing and maintaining standards, promoting health and safety, and ensuring the welfare of our community. They are also aligning with our commitment to a vibrant and secure city.
Our activities aim to protect public health and the environment. Through the trade waste function, we manage wastewater and chemical hazards, responding promptly to water pollution incidents. By registering commercial properties that discharge liquid waste and charging users accordingly, we
58 | Page
cover the expenses associated with waste treatment and disposal and ensure the safety of our waterways and surroundings.
Our animal services activities focus on enforcing regulations to ensure the safety of residents and the welfare of animals.
Finally , our parking services promote safe and efficient parking, ensuring fair access to public car parking spaces and enhance overall traffic management in the city.
Significant negativeeffects and mitigation
The necessity for regulatory measures benefiting the broader community can sometimes diminish perceptions of personal freedom. These regulations may be viewed as obstacles leading to costs and delays.
Key PerformanceIndicators
RegulatoryServices
Weneedtoensurethatnewhousingissafeandmeets standards withoutdelayingtheprocess:
Wewant a
whereeveryonefeels
Capital Projects Regulatory Services- Regulatory Services
There are no capital projects associated with this activity.
59 | Page
PerformanceMeasure Reporting frequency Target2024-25 Target202434
Percentage of building consents processed within statutory timeframe Quarterly 100%within20 days 100%within20 days Code of compliance certificates issued within the statutory timeframe Quarterly 100%within20 days 100%within20 days Percentage of non-notified resource consents processed within the statutory timeframe Quarterly 100%within20 days 100%within20 days
community
Existing food premises verified
time frames (one month
Quarterly 85% by due date 85% by due date Sale and supply of liquor (high risk premises) inspected Quarterly 95% checked 95% checked Noise control (excessive noise) complaints (%) investigated within 45 minutes Quarterly ≥ 85% ≥ 85% Number of animal management community education programmes carried out yearly Quarterly ≥ 20 visits annually ≥ 20 visits annually
safe:
within
of due date)
ProspectiveStatement of ComprehensiveRevenueand Expense - Regulatory Services
Explanations of differences between the10-year plan 2024-2034 and the equivalent years of theAnnual Plan 2023-24 – Regulatory Services
Revenue - Regulatory Services
Revenue has increased by $16.5 million largely due to increases to fees and charges to help offset cost increases in this activity.
Expenditure- Regulatory Services
Expenditure has increased by $32 million and is driven by additional resourcing cost put in place to deal with the demands across this activity.
60 | Page
REGULATORYSERVICES-PROSPECTIVESTATEMENTOFCOMPREHENSIVEREVENUEANDEXPENSE Fortheyearending30June Forecast Draftbudget Forecast Forecast Forecast Forecast Forecast Forecast Forecast Forecast Forecast 2024 2025 2026 2027 2028 2029 2030 2031 2032 2033 2034 $000 $000 $000 $000 $000 $000 $000 $000 $000 $000 $000 REVENUE Rates - - - - - - - - - -Usercharges 8,697 10,402 10,786 11,065 11,381 11,668 11,985 12,274 12,570 12,863 13,170 Operatingsubsidies - - - - - - - - - -Operatinggrants - - - - - - - - - -Capitalsubsidies - - - - - - - - - -CapitalGrants - - - - - - - - - -Development&financialcontributions - - - - - - - - - -Vestedassets - - - - - - - - - -Interestearned - - - - - - - - - -DividendsfromCCOs - - - - - - - - - -Gain/(loss)ondisposalofassets - - - - - - - - - -Otherrevenue 1,354 1,185 1,213 1,239 1,268 1,298 1,323 1,349 1,379 1,402 1,429 Totalrevenue 10,051 11,587 11,999 12,304 12,649 12,966 13,308 13,623 13,949 14,265 14,599 EXPENDITURE Employeecosts 9,556 11,690 12,099 12,523 12,836 13,157 13,486 13,823 14,169 14,523 14,885 Operatingcosts 2,354 1,908 1,995 1,993 2,071 2,107 2,161 2,177 2,267 2,262 2,335 Supportcosts/internalcharges 3,951 4,402 4,149 4,230 4,262 4,412 4,620 4,645 4,454 4,539 4,725 Interestexpenditure 279 446 463 554 614 634 661 660 607 525 392 Depreciation 90 (10) 183 104 104 102 89 85 70 63 66 Totalexpenditure 16,230 18,436 18,889 19,404 19,887 20,412 21,017 21,390 21,567 21,912 22,403 SURPLUS/(DEFICIT)BEFORETAX (6,179) (6,849) (6,890) (7,100) (7,238) (7,446) (7,709) (7,767) (7,618) (7,647) (7,804) TOTALCAPITALEXPENDITURE - - - - - - - - - -PROSPECTIVEFUNDINGREQUIREMENT RATESFUNDINGREQUIREMENT Surplus/(deficit) (6,179) (6,849) (6,890) (7,100) (7,238) (7,446) (7,709) (7,767) (7,618) (7,647) (7,804) Addcapitalcontributions - - - - - - - - - -Ratefundeddebt/(debtrepayment) - - - - - - - - - -Totalratesfundingrequirement (6,179) (6,849) (6,890) (7,100) (7,238) (7,446) (7,709) (7,767) (7,618) (7,647) (7,804) LOANFUNDINGREQUIREMENT Capitaltomeetadditionaldemand - - - - - - - - - -Capitaltoimprovelevelofservice - - - - - - - - - -Capitaltoreplaceexistingassets - - - - - - - - - -Lesscapitalcontributions - - - - - - - - - -LessUHCCcapitalcontribution - - - - - - - - - -Lessdepreciation 90 (10) 183 104 104 102 89 85 70 63 66 Lessassetsales - - - - - - - - - -Lessratefundeddebtrepayment - - - - - - - - - -Totalloan(funding)/repayment 90 (10) 183 104 104 102 89 85 70 63 66 TOTALFUNDINGREQUIREMENT (6,089) (6,859) (6,707) (6,996) (7,134) (7,344) (7,620) (7,682) (7,548) (7,584) (7,738)
Oranga Ōhanga - Economic Wellbeing
61 | Page
Introduction to Economic Wellbeing Section
A thriving economy is essential for the wellbeing of our people. A strong and sustainable economy provides better job opportunities, higher wages, and a higher living standard for residents. It also builds business confidence, provides commercial opportunities and attracts more investment into the city.
We take a partnership approach to growing the city’s sustainable economic success, building capability within our community and making it easy to do business in Te Awa Kairangi ki Tai Lower Hutt.
Taking the next steps in our work work for the next 10 years involves enhancing our engagement with Māori and Pasifika business communities, supporting partnerships to grow our workforce to meet our infrastructure needs and cement our competitive advantage in the science, technology, manufacturing and innovation sectors.
We will facilitate a circular economy through zero waste and zero carbon initiatives and developing capability. To explain a little more, a circular economy is an economic system that aims to minimise waste and maximise the efficient use of resources. It also looks to regenerate nature and reduce the environmental impact of our activity.
We will celebrate our city’s identity and promoting Lower Hutt, it’s people and businesses to attract investment, spending, and tourism that delivers an effective circular economy.
62 | Page
Economic Wellbeing Dashboard
Infographics [dashboard details to be confirmed and updated]
GDP (Sep 2023)
$7,580M (Infometrics)
Consumer Spending (Sep 2023)
$1,684M (Infometrics)
Income Median annual individual income
$34,700 (Census 2018)
Annual individual income by income group (census 2018)
$20,000 or less – 32%
$20,001 - $40,000 – 23%
$40,001 - $60,000 – 18%
$60,001 - $100,000 – 17%
$100,001 - $150,000 – 6%
$150,001 or more – 3%
Unemployment rate (Sep 2023)
2.80% (Infometrics)`
NEET rate (Year end March 2023)
5.2% (15-19 year olds) (Stats NZ)
10.3% (20-24 year olds) (Stats NZ)
63 | Page
Number of Jobseeker supplement recipients (Sep 2023)
4,133 (Infometrics)
Number of businesses (Sep 2023)
11,143 (Infometrics)
Communication Access (Census 2018)
Access to cell phone /mobile phone 93% (Census 2018)
Access to internet 87% (Census 2018)
No access to telecommunication systems 1% (Census 2018)
Average house value (Sep 2023)
$757,669 (Infometrics)
Average rent (Sep 2023)
$550 (Tenancy Services)
Housing Affordability (average house value to average household income – Sep 2023)
5.5 (Infometrics)
Rental Affordability (average rent to average household income Sep 2023)
28% (Homes.co.nz and Stats NZ via Dot Loves Data)
Number of households on Housing Register (Sep 2023)
564 (Ministry of Social Development)
Ability to cover every day needs
43% not enough or just enough (Quality of Life 2022)
53% enough or more than enough (Quality of Life 2022)
64 | Page
Stories for Economic Wellbeing
Whiria temuka tangata, whārikihia te Kaupapa | Council’s Integrated Transport Strategy
A great transport system connects our communities, provides access to social opportunities, and helps grow our economy. But like other cities, Te Awa Kairangi Lower Hutt facing some big challenges, including a fast-growing population, higher costs and a changing climate.
The Integrated Transport Strategy outlines Council’s vision, and strategic direction for responding to the city’s growing transport challenges. It lays out an integrated approach to delivering land use planning, transport planning, investment and encouraging behaviour change within Te Awa Kairangi Lower Hutt.
The Strategy is now guiding Council’s decision making about changes to the transport system to address the challenges our communities are facing. We’re now developing a plan under each of the seven Strategy focus areas, along with key targets and measures. A range of measures will be used to indicate whether the direction of change is in keeping with the vision of this Strategy, including mode shift, journey times, carbon emissions, health-related measures, economic growth, safety trends, and resident satisfaction.
You can find more information about Council’s Integrated Transport Strategy here - Link
65 | Page
Ngā waka | Transport
Statements of ServicePerformance
What wedo
The Transport team oversees essential programs aimed at maintaining, operating, and enhancing our transport system, and a continuous improvement approach for infrastructure development. Our focus prioritises road safety, encourages mode-shift in transport choice, improved travel options, with a specific emphasis on mitigating climate change and delivery of infrastructure projects in a timely manner. Our goal is to have a wellconnected and modern transport system that accommodates all modes of transportation and ensures accessibility and connectivity throughout the city. Why wedo it
Our commitment is to future-proofing our growing city for future generations. We strive to establish a resilient and interconnected transport system that offers increased accessibility and encourages alternative modes of transport (for example Tupua Horo Nuku). Our efforts in road and traffic asset management, maintenance contracts, road safety services, and active modes aim to provide well-maintained roads, footpaths, and streetlights. This infrastructure facilitates efficient and secure travel for motor vehicles, bicycles, and pedestrians, aligning with our vision of a vibrant and connected city. We are also investing in projects to improve the resilience of our networks in the face of a changing climate. A good example is the work on Eastern Hutt Road which, when finished, will improve the reliability of the road to Council’s Northern suburbs.
Significant negativeeffects and mitigation
The possible environmental impacts of increasing transportation demand include various forms of pollution such as increased water runoff contamination from roads, emissions of particulates from heavy road vehicles, air pollutants
66 | Page
from road traffic, as well as traffic noise and vibrations. Additionally, congestion on vital routes, the loss of productive and recreational land for transportation infrastructure, and public health risks associated with traffic accidents are concerns. Transport planning takes into account these adverse effects and includes measures to address them. Efforts are made to reduce crashes through studies and necessary interventions in high-crash areas. Works are carried out annually to minimise traffic delays and consequently reduce air pollution. Furthermore, alternative modes of transportation are actively promoted.
Key PerformanceIndicators
Transport
Weneedtobeabletotravelalongkeyroutesefficiently:
Road condition index which measures the condition of the road surface
The average quality of ride on a sealed local road network, measured by smooth travel exposure
sealed local road network that is resurfaced annually
Percentage
footpaths that fall within the service standard for footpath condition
Percentage of customer service requests relating to roads and footpaths that are responded to within the statutory timeframe
Kilometres of shared pathways and cycle lanes added annually.
Kilometres of renewals for footpaths
Weareworkingtostrengthenouractivetransportnetwork: Resident satisfaction with the footpath condition
Resident satisfaction with on road cycleway condition
67 | Page
PerformanceMeasure Reporting frequency Target202425 Target202434
Annual Hold or improve
Hold
improve
rating
or
rating
Annual Hold
improve
Hold
of
Annual ≥ 2% ≥ 2%
or
rating
or improve rating Percentage
Annual ≥ 80% ≥ 80%
of
Annual 80% within7 days 80% within7 days
Quarterly Hold
Hold
or improve length
or improve length
Quarterly Hold
Hold
Audit of contracts – number of contracts audited Quarterly 12 of12 12 of12 Audit of contracts – percentage of audited contract specifications that met contractual obligations Quarterly ≥ 90% ≥ 90%
or improve length
or improve length InfrastructurecontractsmanagedbyCouncilcontributetosocialoutcomes:
Annual ≥ 80% ≥ 80%
Annual ≥ 80% ≥ 80%
Resident satisfaction with shared path condition Annual ≥ 80% ≥ 80%
Resident satisfaction with the availability of car parking to access services and facilities (does not include access to residences)
Roadsafetyservices:
The number of fatalities and serious injury crashes on the local road network
Annual ≥75% ≥75%
Quarterly Previous year less 1% Previous year less 1% Capital
68 | Page
Capitalprojects Transport 2023/2024 2024/2025 2025/2026 2026/2027 2027/2028 2028/2029 2029/2030 2030/2031 2031/2032 2032/2033 2033/2034 ProjectDescription Forecast Draft Forecast Forecast Forecast Forecast Forecast Forecast Forecast Forecast Forecast $000 $000 $000 $000 $000 $000 $000 $000 $000 $000 $000 Capitalprojectstomeetadditionaldemand CrossValleyConnections-Growth 65 118 61 - 2,353 2,733 1,422 1,428 1,208 -CyclingMicro-mobilityProgrammeGrowth - 487 238 237 237 582 510 647 - -MinorSafetyWorksGrowth 1 1 1 1 1 1 1 1 1 1 1 TrafficSafetyImprovementsGrowth 21 22 22 23 23 24 24 25 25 26 26 LocalAreaTrafficManagementGrowth 2 2 2 2 2 2 2 2 3 3 3 PedestrianCrossingNewGrowth 1 1 1 1 1 1 1 1 1 1 1 RoadNetworkImprovements-Growth 188 182 152 126 134 170 164 168 226 230 235 SubdivisionsRoadImprovements - 3,500 3,577 3,659 3,744 3,826 3,906 3,984 4,064 4,141 4,220 Capitalprojectstoreplaceexistingassets AreaWidePavementTreatment 3,363 7,568 7,734 7,964 8,148 8,327 8,501 8,672 8,845 9,013 9,184 PavementSurfacing 4,216 2,698 2,757 2,873 2,939 3,004 3,067 3,128 3,191 3,251 3,313 FootpathResurfacingAndReplacement 686 446 456 467 477 488 498 508 518 528 538 MinorRoadAndFootpathConstruction 78 81 82 84 86 88 90 92 94 95 97 RoadReconstruction 316 327 334 341 349 357 364 372 379 386 394 WainuiomataHillRdSafetySeal 1,341 753 719 787 805 823 840 857 874 891 908 TrafficSignalReplacement 179 185 189 193 198 202 207 211 215 219 223 MinorSafetyWorks 53 54 56 57 58 59 61 62 63 64 66 PedestrianCrossingRenewal 33 34 34 35 36 37 38 38 39 40 41 StreetlightLanternReplacementProgramme 185 256 263 270 275 279 285 288 253 258 262 StreetlightStandardReplacement 232 321 329 337 343 349 356 361 316 322 328 CarparkResurfacing 54 56 57 58 59 61 62 63 64 66 67 BridgeRenewals-NortonParkAve/NelsonCres - - - - 1,106 - - - - -EstuaryBridgeCorrosionProtection - - 1,067 - - - - - - -Pay&DisplayExtension - 140 - 195 349 204 - - - - 225 TransportResilienceProjects - 1,313 1,341 1,372 - - - - - -SlipRemediation 3,460 - - - - - - - - -Capitalprojectstoimprovelevelofservice CrossValleyConnections 1,165 2,232 1,153 - 44,706 51,922 27,022 27,131 22,961 -ReconstructionImprovements 84 87 89 91 93 95 97 99 101 103 105 BroadbandDucting 22 23 23 24 24 25 26 26 27 27 28 LandPurchaseForRoads 11 11 11 11 12 12 12 12 13 13 13 SubstandardRdsUpgrade 583 305 311 319 326 333 340 347 700 713 727 CyclingMicromobilityProgramme 10,108 7,376 3,734 2,787 3,716 9,124 7,997 10,129 - -TupuaHoroNuku-EasternBays 18,800 23,835 21,476 - - - - - - -TrafficSafetyImprovements 1,828 1,067 1,090 1,115 1,141 1,166 1,190 1,214 1,239 1,262 1,286 LocalAreaTrafficManagement 103 107 109 112 114 117 119 121 124 126 129 PedestrianCrossings-New 27 28 29 30 30 31 32 32 33 33 34 LEDStreetlighting - 1,009 1,782 1,338 - - - - - -SchoolSpeedZoneProgramme 63 - - - - - - - - -RoadNetworkImprovements 700 780 830 885 806 788 791 786 840 856 873 BridgeSeismicStrengtheningCubaSt.Overbridge 1,338 - - - - - - - - -NetworkResilience-EasternHuttRoad 3,599 12,100 11,549 - - 5,482 5,893 6,085 - -StreetsforpeopleProgram-Micromobility 1,584 - - - - - - - - -WainuiomataCoastRoadRehabilitation 1,500 - - - - - - - - -TransportSpeedReview - 1,000 1,298 - - - - - - -55,988 68,502 62,957 25,795 72,694 90,711 63,918 66,892 46,416 22,670 23,326
Projects - Transport
ProspectiveStatement of ComprehensiveRevenueand Expense – Transport
Explanations of differences between the10-year plan 2024-2034 and the equivalent years of theAnnual Plan 2023-24 - Transport
Revenue - Transport
Revenue has increased by $89 million largely due to proposed parking fee changes, increases in capital/operating subsidies and grants linked to higher costs, and development contributions revenue linked to planned projects driven by growth.
Expenditure- Transport
Expenditure has increased by $93 million, driven by higher operating cost budgets for a range of renewed contracts for maintenance activities, additional resourcing put in place and higher depreciation costs linked to the increased capital investment.
69 | Page
TRANSPORT-PROSPECTIVESTATEMENTOFCOMPREHENSIVEREVENUEANDEXPENSE Fortheyearending30June Forecast Draftbudget Forecast Forecast Forecast Forecast Forecast Forecast Forecast Forecast Forecast 2024 2025 2026 2027 2028 2029 2030 2031 2032 2033 2034 $000 $000 $000 $000 $000 $000 $000 $000 $000 $000 $000 REVENUE Rates - - - - - - - - - -Usercharges 5,516 7,505 7,857 8,116 8,536 8,723 8,906 9,085 9,266 9,442 9,622 Operatingsubsidies 5,917 8,150 8,329 8,520 8,717 8,908 9,095 9,277 9,462 9,643 9,826 Operatinggrants - - - - - - - - - -Capitalsubsidies 16,745 28,294 28,425 12,028 35,328 45,134 31,564 33,070 22,383 10,248 10,442 CapitalGrants 15,098 11,060 4,714 - - - - - - -Development&financialcontributions 428 1,123 1,471 1,733 1,853 1,912 2,335 2,292 2,231 2,179 2,185 Vestedassets 537 555 567 580 594 607 620 632 645 657 669 Interestearned - - - - - - - - - -DividendsfromCCOs - - - - - - - - - -Gain/(loss)ondisposalofassets - - - - - - - - - -Otherrevenue 557 576 589 602 616 630 643 656 669 681 694 Totalrevenue 44,798 57,263 51,952 31,579 55,644 65,914 53,163 55,012 44,656 32,850 33,438 EXPENDITURE Employeecosts 2,047 2,722 2,818 2,916 2,989 3,064 3,140 3,219 3,299 3,382 3,466 Operatingcosts 19,848 21,470 21,868 22,229 22,312 22,830 23,312 23,760 24,235 24,700 25,174 Supportcosts/internalcharges 4,414 4,496 4,700 4,798 4,919 5,047 5,242 5,215 5,297 5,404 5,578 Interestexpenditure 2,297 3,030 3,247 3,406 3,384 3,671 3,592 2,928 1,289 46 45 Depreciation 19,709 22,697 25,431 27,649 32,592 37,924 41,418 45,291 47,498 49,166 52,713 Totalexpenditure 48,315 54,415 58,064 60,998 66,196 72,536 76,704 80,413 81,618 82,698 86,976 SURPLUS/(DEFICIT)BEFORETAX (3,517) 2,848 (6,112) (29,419) (10,552) (6,622) (23,541) (25,401) (36,962) (49,848) (53,538) TOTALCAPITALEXPENDITURE 55,987 68,501 62,958 25,795 72,694 90,711 63,918 66,892 46,416 22,670 23,326 PROSPECTIVEFUNDINGREQUIREMENT RATESFUNDINGREQUIREMENT Surplus/(deficit) (3,517) 2,848 (6,112) (29,419) (10,552) (6,622) (23,541) (25,401) (36,962) (49,848) (53,538) Addcapitalcontributions (32,271) (40,477) (34,610) (13,761) (37,181) (47,046) (33,899) (35,362) (24,614) (12,427) (12,627) Ratefundeddebt/(debtrepayment) - - - - - - - - - -Totalratesfundingrequirement (35,788) (37,629) (40,722) (43,180) (47,733) (53,668) (57,440) (60,763) (61,576) (62,275) (66,165) LOANFUNDINGREQUIREMENT Capitaltomeetadditionaldemand (278) (4,311) (4,055) (4,050) (6,495) (7,339) (6,031) (6,256) (5,528) (4,402) (4,486) Capitaltoimprovelevelofservice (41,515) (49,960) (43,485) (6,711) (50,969) (69,094) (43,519) (45,984) (26,037) (3,134) (3,194) Capitaltoreplaceexistingassets (14,194) (14,230) (15,418) (15,034) (15,230) (14,278) (14,368) (14,652) (14,851) (15,134) (15,646) Lesscapitalcontributions 32,271 40,477 34,610 13,761 37,181 47,046 33,899 35,362 24,614 12,427 12,627 LessUHCCcapitalcontribution - - - - - - - - - -Lessdepreciation 19,709 22,697 25,431 27,649 32,592 37,924 41,418 45,291 47,498 49,166 52,713 Lessassetsales - - - - - - - - - -Lessratefundeddebtrepayment - - - - - - - - - -Totalloan(funding)/repayment (4,007) (5,327) (2,917) 15,615 (2,921) (5,741) 11,399 13,761 25,696 38,923 42,014 TOTALFUNDINGREQUIREMENT (39,795) (42,956) (43,639) (27,565) (50,654) (59,409) (46,041) (47,002) (35,880) (23,352) (24,151)
Capital - Transport
Capital expenditure has increased by $95 million based on cost escalations across several existing projects (for e.g. area-wide pavement treatment) ), some new projects planned to deal with growth impacts on the roading network like Subdivision improvements project and additional funding for network resilience work like Eastern Hutt Road resilience.
70 | Page
Whanake tāone | City development
Statements of ServicePerformance
What wedo
Providing essential services that cater for the needs of residents, businesses, and visitors is crucial for the economic development of Te Awa Kairangi Lower Hutt. The City Development Group oversees various activities, including urban design, business support and city growth, housing, and the District Plan. This multifaceted approach ensures a comprehensive strategy for the city's development and wellbeing.
Why wedo it
Our commitment to enhancing the quality of life for residents drives our efforts. Easy access to recreational green spaces, the Te Awa Kairangi Hutt River, and the Te Whanganui a Tara harbour contributes to our distinctive appeal. By supporting the business sector and promoting Te Awa Kairangi ki Tai Lower Hutt as a vibrant business location, we create a positive ripple effect, benefiting local enterprises and residents alike. Initiatives like placemaking, supported events, and collaborations not only add vibrancy to the city but also attract visitors. Collaborating with partners fosters better connectedness within our business community, facilitating skill development and capability enhancement for future growth. Overall, our work aims to create a thriving and interconnected community that contributes to the city's economic prosperity and cultural richness.
Significant negativeeffects and mitigation
Concentrating on economic sectors with lower value might draw away attention and resources from those sectors capable of delivering higher long-term value to the city.
71 | Page
Capital Projects
Operating Projects over $250k per year
72 | Page
Capitalprojects CityDevelopment 2023/2024 2024/2025 2025/2026 2026/2027 2027/2028 2028/2029 2029/2030 2030/2031 2031/2032 2032/2033 2033/2034 ProjectDescription Forecast Draft Forecast Forecast Forecast Forecast Forecast Forecast Forecast Forecast Forecast $000 $000 $000 $000 $000 $000 $000 $000 $000 $000 $000 Capitalprojectstomeetadditionaldemand UrbanGrowthStrategyImprovements 1,560 - - - - - - - - -WainuiomataTownCentrereservedevelopment 500 - - - - - - - - -Capitalprojectstoreplaceexistingassets CivicEventsCentreRenewal - 57 37 798 536 48 479 254 186 676 231 Capitalprojectstoimprovelevelofservice Petone2040 565 218 222 228 233 238 243 248 253 258 262 NaenaeTownCentreImprovements 3,038 2,587 - - - - - - - -WainuiomataQueenStreetDevelopment 1,085 - - - - - - - - -RiverLink-StrategicPropertyPurchases 450 2,850 3,032 958 - - - - - -RiverLink-Streetscapes 5,860 - - 3,240 11,020 30,570 - - - -RiverLink-Replacementriverbankcarpark 380 - - - - 2,880 - - - -RiverLink-Intersections 2,890 10,340 10,130 - - - - - - -RiverLink-Riverbankpark 4,580 2,590 5,280 10,790 11,020 3,970 - - - -RiverLink-Bridge 7,000 15,510 26,400 8,030 - - - - - -27,907 34,151 45,102 24,044 22,809 37,706 722 502 439 934 494 City Development 2023/2024 2024/2025 2025/2026 2026/2027 2027/2028 2028/2029 2029/2030 2030/2031 2031/2032 2032/2033 2033/2034 Project Forecast Draft Budget Forecast Forecast Forecast Forecast Forecast Forecast Forecast Forecast Forecast Description $000 $000 $000 $000 $000 $000 $000 $000 $000 $000 $000 DevelopmentStimulusPackage 6,662 2,793 337 311 - - - - - -Total 6,662 2,793 337 311 - - - - - -Operating projects
ProspectiveStatement of ComprehensiveRevenueand Expense
Explanations of differences between the10Year Plan 2024-2034 and the equivalent years of theAnnual Plan 2023-24 – City Development
Revenue – City Development
Revenue has increased by $19 million largely due to an assumed NZ Transport Agency Waka Kotahi subsidy for capital spend related to Te Wai Takamori o Te Awa Kairangi – RiverLink.
Expenditure –City Development
Expenditure has increased by $22 million and is driven by higher operating cost allocation for internal support activities and interest costs linked to the higher capital spend.
73 | Page
CITYDEVELOPMENT-PROSPECTIVESTATEMENTOFCOMPREHENSIVEREVENUEANDEXPENSE Fortheyearending30June Forecast Draftbudget Forecast Forecast Forecast Forecast Forecast Forecast Forecast Forecast Forecast 2024 2025 2026 2027 2028 2029 2030 2031 2032 2033 2034 $000 $000 $000 $000 $000 $000 $000 $000 $000 $000 $000 REVENUE Rates - - - - - - - - - -Usercharges 84 87 89 91 93 95 97 99 101 103 105 Operatingsubsidies - - - - - - - - - -Operatinggrants - - - - - - - - - -Capitalsubsidies 5,043 13,184 19,040 4,282 - - - - - -CapitalGrants - - - - - - - - - -Development&financialcontributions - - - - - - - - - -Vestedassets - - - - - - - - - -Interestearned - - - - - - - - - -DividendsfromCCOs - - - - - - - - - -Gain/(loss)ondisposalofassets - - - - - - - - - -Otherrevenue - - - - - - - - - -Totalrevenue 5,127 13,271 19,129 4,373 93 95 97 99 101 103 105 EXPENDITURE Employeecosts 1,679 1,958 2,027 2,098 2,150 2,204 2,259 2,316 2,374 2,433 2,494 Operatingcosts 12,870 6,181 3,385 2,669 2,029 2,101 2,088 2,135 2,193 2,161 2,207 Supportcosts/internalcharges 2,309 3,050 3,088 3,177 3,224 3,314 3,455 3,482 3,503 3,586 3,683 Interestexpenditure 2,183 3,578 4,390 5,692 6,653 8,030 8,512 8,732 8,684 8,563 8,037 Depreciation 12 (7) 30 30 32 32 29 27 27 27 28 Totalexpenditure 19,053 14,760 12,920 13,666 14,088 15,681 16,343 16,692 16,781 16,770 16,449 SURPLUS/(DEFICIT)BEFORETAX (13,926) (1,489) 6,209 (9,293) (13,995) (15,586) (16,246) (16,593) (16,680) (16,667) (16,344) TOTALCAPITALEXPENDITURE 27,907 34,152 45,101 24,044 22,809 37,706 722 502 439 934 493 PROSPECTIVEFUNDINGREQUIREMENT RATESFUNDINGREQUIREMENT Surplus/(deficit) (13,926) (1,489) 6,209 (9,293) (13,995) (15,586) (16,246) (16,593) (16,680) (16,667) (16,344) Addcapitalcontributions (5,043) (13,184) (19,040) (4,282) - - - - - -Ratefundeddebt/(debtrepayment) - - - - - - - - - -Totalratesfundingrequirement (18,969) (14,673) (12,831) (13,575) (13,995) (15,586) (16,246) (16,593) (16,680) (16,667) (16,344) LOANFUNDINGREQUIREMENT Capitaltomeetadditionaldemand (2,060) - - - - - - - - -Capitaltoimprovelevelofservice (25,847) (34,095) (45,064) (23,246) (22,273) (37,658) (243) (248) (253) (258) (262) Capitaltoreplaceexistingassets - (57) (37) (798) (536) (48) (479) (254) (186) (676) (231) Lesscapitalcontributions 5,043 13,184 19,040 4,282 - - - - - -LessUHCCcapitalcontribution - - - - - - - - - -Lessdepreciation 12 (7) 30 30 32 32 29 27 27 27 28 Lessassetsales - 1,073 1,093 5,591 5,737 5,892 - - - -Lessratefundeddebtrepayment - - - - - - - - - -Totalloan(funding)/repayment (22,852) (19,902) (24,938) (14,141) (17,040) (31,782) (693) (475) (412) (907) (465) TOTALFUNDINGREQUIREMENT (41,821) (34,575) (37,769) (27,716) (31,035) (47,368) (16,939) (17,068) (17,092) (17,574) (16,809)
Capital – City Development
Capital expenditure has increased by $68 million based on cost escalation across several existing projects mainly for Te Wai Takamori o Te Awa Kairangi –RiverLink.
74 | Page
Oranga Hapori me te Oranga
Ahurea - Social & Cultural
Wellbeing
75 | Page
Introduction to Social & Cultural Wellbeing Section
Social &Cultural Wellbeing in TeAwa Kairangi ki Tai Lower Hutt
Our city reflects a diverse community, with a quarter born overseas, 18 percent identifying as Māori, 12 percent as Pacific Peoples, and 15 percent as Asian. Additionally, over 20 percent speak two or more languages. 20 percent reside in the most deprived areas, while 25 percent live in the least deprived areas in New Zealand.
We want neighbourhoods and communities that are safe, connected, healthy, inclusive, and resilient. Our neighbourhoods and communities give us a sense of place and purpose. Council’s role is to support and enable neighbourhoods and communities to thrive.
Council staff alongside communities to support community-led initiatives and solutions to local issues. We use community forums and interactions to establish a community voice on specific issues and work on issues with groups and agencies across Te Awa Kairangi ki Tai Lower Hutt.
We operate a number of neighbourhood hubs and community halls, offering a mix of community-led, Council, and agency-led activities and services.
Social and Cultural outcome measures provide insight into the quality of our city's social and cultural wellbeing. Council initiatives, such as programs, events, and facility spaces, aim to impact these outcomes positively by fostering community participation, reducing social isolation, and enhancing overall wellbeing.
76 | Page
Social & Cultural Wellbeing
Dashboard
Infographics
Lower Hutt residents participation in groups and clubs (2022)( Quality of Life Survey )
Club or society – 23%
Faith based group – 21%
Neighbourhood group- 11%
Physical activity participation
Engaged in physical activity 5+ days a week in 2022 – 29%
Attendance at school
Rate per 1,000 students (2021 school year)
Stand downs- 31
Suspensions -2
Exclusions – 0.5
School leavers
Highest NCEA level attained by Lower Hutt school leavers (Education Counts)
with NCEA level 1 - 10.36% (2022 School year)
with NCEA level 2- 23.97% (2022 School year)
with NCEA level 3 or higher- 17.65% (2022 School year)
with University Entrance – 37.14% (2022 School year)
Early childhood education in Lower Hutt
Waiting time for enrolling in early childhood education service
No wait – 30% (2022 School year)(Education Counts)
Up to 1 month – 7% (2022 School year)(Education Counts)
1 to 6 months – 27% (2022 School year)(Education Counts)
Over 6 months – 21% (2022 School year)(Education Counts)
77 | Page
Stories for Social & Cultural Wellbeing
Celebrating theprogress of NaenaePool construction
The new Naenae Pool and Fitness Centre project hit a big milestone at the end of 2023 as our contractors finished the construction of the main steel structure. Everything's on track, and we're expecting the new facility to be officially launched to the community mid to late 2024.
What's great about this project is that the pool building is designed to be super eco-friendly. It's set to be the first aquatic centre in New Zealand to get a Green Five Star rating. This means it's going to cut down on emissions by 50% compared to the old Naenae Olympic Pool.
Alongside the pool, there's a new community centre in the old post office building, which is a special spot with a Heritage Category 1 tag. We’re also planning to give a facelift to the North-East corner of Walter Mildenhall Park. All these projects are going to bring new life to Naenae's town centre.
So, not only are we getting a revamped place to swim and stay fit, but we're also doing it in a way that's kind to the environment. Plus, with the new community centre and park improvements, Naenae is on track to have a vibrant and lively centre once again
78 | Page
Subsections for Social & Cultural
Wellbeing
79 | Page
Hō mātou rangapū hapori me te mahi ngātahi | Community partnering and support
Statements of Service Performance
What wedo
Ensuring the prosperity of our city hinges on the creation of secure, interconnected, healthy, inclusive, and resilient neighbourhoods and communities. Recognising the important role communities play in fostering a sense of belonging and purpose, Council is committed to supporting local groups to improve their overall wellbeing.
Through our hubs, recreation, and digital connection, community and agency initiatives we actively support wellbeing-focused services and programs. Collaborative initiatives aimed at enhancing social and cultural wellbeing play a crucial role in fostering community connectedness and a sense of belonging. Council’s role is to oversee the implementation and ongoing review of the Homelessness Strategy for Lower Hutt. We collaborate closely with partners and service providers to address homelessness effectively, with a particular focus on supporting individuals and families experiencing homelessness.
Why wedo it
Our commitment to community wellbeing is seen through collaborative efforts with local communities to facilitate and support local initiatives. We want to help establish a collective community voice on specific issues and foster collaboration with groups and agencies across Te Awa Kairangi ki Tai Lower Hutt.
Council’s facilities such as hubs contribute to the wellbeing of our people and vitality of the city by:
• providing recreation opportunities that enhance individual health and wellbeing, including personal development and quality of life; and
• attracting visitors and therefore providing economic benefits to the district.
80 | Page
A primary objective is to ensure that individuals and families facing homelessness have the necessary support and resources to secure stable housing. We prioritise prevention efforts to minimise the occurrence of homelessness and strive to create a community where everyone has access to safe and secure housing.
Significant negativeeffects and mitigation
Activities that facilitate gatherings and involve public spaces can have adverse effects, exposing participants to inherent risks. Certain programs and services offered at community hubs may potentially pose risks of injury to participants. Nonetheless, these risks are mitigated by the presence of trained staff. Systems are in position to regulate the rental and utilisation of community facilities, ensuring community safety.
Key PerformanceIndicators
Communitypartneringandsupport
81 | Page
PerformanceMeasure Reporting frequency Target202425 Target202434 Weare workingtohelppeoplefacinghomelessnessandhousinghardship: Number of Te AwaKairangi Lower Hutt households assisted into more settled accommodation Quarterly 50 50 Number of households provided with legal housing advice and advocacy Quarterly 80 80 Number of households assisted by the homelessness prevention programme Quarterly 80 80 Weprovidesafespaces forsocial,leisureandeducationalactivities: Number of neighbourhood hubs who met visitor number targets Quarterly 9 of9 9 of9 Resident satisfaction with neighbourhood hubs Annual ≥ 80% ≥ 80% Number of community wellbeing activities delivered by, or in partnership with, Council Quarterly ≥ 3000 ≥ 3000 Number of overall loans from hubs/libraries Quarterly ≥ 790,000 ≥ 790,000 Number of digital literacy programmes/activities delivered/enabled Quarterly 100 100 Number of early years literacy programmes/activities delivered/enabled Quarterly 800 800 Number of Neighbourhood Support member households Quarterly Previous year plus 10% (87 in Nov 2023) Previous year plus 10% (87 in Nov 2023)
Capital Projects -Community partnering and support
82 | Page
Capitalprojects CommunityPartnering&Support 2023/2024 2024/2025 2025/2026 2026/2027 2027/2028 2028/2029 2029/2030 2030/2031 2031/2032 2032/2033 2033/2034 ProjectDescription Forecast Draft Forecast Forecast Forecast Forecast Forecast Forecast Forecast Forecast Forecast $000 $000 $000 $000 $000 $000 $000 $000 $000 $000 $000 Capitalprojectstoreplaceexistingassets CommunityHallsExternalandInternalRenewal 105 - - - - - - - - -BelmontMemorialHallRenewal - 0 23 6 67 1 134 - 52 - 14 EastbourneHallRenewal - 18 66 34 98 2 126 4 212 - 45 EpuniHallRenewal - 34 54 24 31 1 139 - 24 - 26 WainuiomataMemorialHallRenewal - 1 33 10 47 8 91 8 57 6 11 MaungarakiHallRenewal - 55 35 203 29 0 402 103 2 - 37 WalterNashCentreRenewal 242 3 184 219 523 1 1,082 565 257 - 252 StokesValleyHubRenewal 98 1 73 67 227 14 284 2 145 5 46 WainuiomataHubRenewal 6 15 76 58 317 3 250 1 118 1 77 CommunityHubs-Furniture&EquipmentReplacements 5 5 5 5 5 362 5 6 6 6 6 CCTVReplacement 90 33 33 34 35 36 49 37 38 39 131 CommunityHousesBuildingRenewal 53 72 182 92 304 29 305 11 109 12MoeraCommunityHallRenewal - 74 50 8 88 - 52 41 3 0 27 TreadwellCommunityHallRenewal - 33 54 23 30 24 26 19 11 9 27 Hardwick-SmithLoungeRenewal - 137 17 92 19 - 0 - - -HuttArtSocietyRenewal - 5 59 60 91 8 210 36 2 - 30 Capitalprojectstoimprovelevelofservice CommunityHallsImprovements 105 - - - - - - - - -WalterNashCentreEquipmentandFitout 95 - - - 105 - - - - -WalterNashTaitaCentreFurniture 53 - - - - - - - - -CommunityHubs-BuildingImprovements 5 5 6 6 6 6 6 6 6 6 7 DecarbonisationEnergyConversion - - - - - - 486 - - -CommunityPanelProjects 336 - - 520 - - 555 - - 589CommunityHouses - - 56 - - 59 - - 63 -1,192 490 1,005 1,462 2,022 556 4,202 839 1,107 672 737
ProspectiveStatement of ComprehensiveRevenueand Expense - Community partnering and support
Explanationsof differences between the 10 YearPlan 2024-2034 andthe equivalent years of the Annual Plan 2023-24 - Communitypartnering and support
Revenue - Community partnering and support
No material variance.
Expenditure -Community partnering and support
Expenditure has increased by $33 million and is driven mainly by higher operating cost allocation for internal support activities and depreciation cost linked to the updated capital programme.
Capital -Community partnering and support
Capital expenditure has increased by $2.6 million based on investigation and updated cost estimates for the required capital works.
83 | Page
COMMUNITYPARTNERING&SUPPORT-PROSPECTIVESTATEMENTOFCOMPREHENSIVEREVENUEANDEXPENSE Fortheyearending30June Forecast Draftbudget Forecast Forecast Forecast Forecast Forecast Forecast Forecast Forecast Forecast 2024 2025 2026 2027 2028 2029 2030 2031 2032 2033 2034 $000 $000 $000 $000 $000 $000 $000 $000 $000 $000 $000 REVENUE Rates - - - - - - - - - -Usercharges 477 518 529 542 554 549 560 572 583 594 605 Operatingsubsidies - - - - - - - - - -Operatinggrants 5 5 6 6 6 6 6 6 6 6 7 Capitalsubsidies - - - - - - - - - -CapitalGrants - - - - - - - - - -Development&financialcontributions - - - - - - - - - -Vestedassets - - - - - - - - - -Interestearned - - - - - - - - - -DividendsfromCCOs - - - - - - - - - -Gain/(loss)ondisposalofassets - - - - - - - - - -Otherrevenue 994 1,031 1,053 11 11 11 12 12 12 12 13 Totalrevenue 1,476 1,554 1,588 559 571 566 578 590 601 612 625 EXPENDITURE Employeecosts 4,125 4,103 4,234 3,308 3,391 3,476 3,563 3,652 3,743 3,837 3,932 Operatingcosts 4,752 4,409 4,549 4,574 4,654 4,621 4,719 4,808 4,905 5,003 5,094 Supportcosts/internalcharges 1,798 4,313 4,365 4,387 4,589 4,760 4,995 4,864 4,870 4,983 5,283 Interestexpenditure 432 661 695 856 953 925 1,067 970 779 485 114 Depreciation 1,447 1,717 1,779 1,870 2,103 2,228 2,473 2,820 2,909 3,032 3,200 Totalexpenditure 12,554 15,203 15,622 14,995 15,690 16,010 16,817 17,114 17,206 17,340 17,623 SURPLUS/(DEFICIT)BEFORETAX (11,078) (13,649) (14,034) (14,436) (15,119) (15,444) (16,239) (16,524) (16,605) (16,728) (16,998) TOTALCAPITALEXPENDITURE 1,193 490 1,005 1,462 2,023 555 4,201 839 1,107 673 738 PROSPECTIVEFUNDINGREQUIREMENT RATESFUNDINGREQUIREMENT Surplus/(deficit) (11,078) (13,649) (14,034) (14,436) (15,119) (15,444) (16,239) (16,524) (16,605) (16,728) (16,998) Addcapitalcontributions - - - - - - - - - -Ratefundeddebt/(debtrepayment) - - - - - - - - - -Totalratesfundingrequirement (11,078) (13,649) (14,034) (14,436) (15,119) (15,444) (16,239) (16,524) (16,605) (16,728) (16,998) LOANFUNDINGREQUIREMENT Capitaltomeetadditionaldemand - - - - - - - - - -Capitaltoimprovelevelofservice (594) (5) (61) (526) (111) (65) (1,047) (6) (70) (595) (7) Capitaltoreplaceexistingassets (599) (485) (944) (936) (1,912) (490) (3,154) (833) (1,037) (78) (731) Lesscapitalcontributions - - - - - - - - - -LessUHCCcapitalcontribution - - - - - - - - - -Lessdepreciation 1,447 1,717 1,779 1,870 2,103 2,228 2,473 2,820 2,909 3,032 3,200 Lessassetsales - - - - - - - - - -Lessratefundeddebtrepayment - - - - - - - - - -Totalloan(funding)/repayment 254 1,227 774 408 80 1,673 (1,728) 1,981 1,802 2,359 2,462 TOTALFUNDINGREQUIREMENT (10,824) (12,422) (13,260) (14,028) (15,039) (13,771) (17,967) (14,543) (14,803) (14,369) (14,536)
Papa rēhia me ngā whenua tāpui |
Open spaces, parks and reserves
Statements of ServicePerformance
What wedo
We are responsible for creating an attractive living environment in Te Awa Kairangi ki Tai Lower Hutt. This is seen through the provision, development, maintenance, and protection of open spaces, parks, reserves, sportsgrounds, street gardens, and street trees.
These areas not only enhance the aesthetic appeal of our city but also serve as important venues for recreation, gatherings, and informal social occasions.
Why wedo it
Council understands the impact of sport and recreation on the wellbeing of individuals, both physically and psychologically. We actively contribute to the development and maintenance of an extensive reserve network. These reserves not only foster a healthy natural environment but also serve as a platform for bringing people together for social activities. Through sportsgrounds, civic parks, neighbourhood parks, bush reserves, cemeteries, playgrounds, the foreshore, street trees, and gardens, we strive to create a pleasant environment accessible to the entire community.
For example, in Council’s bush reserves, we focus on creating connected native habitats that host a diverse range of native species. This collaborative effort aligns with the broader initiatives of entities such as Greater Wellington Regional Council and the Department of Conservation (DOC), collectively contributing to the preservation and enhancement of our natural heritage.
Significant negativeeffects and mitigation
Places where people gather can have drawbacks and expose individuals to the typical risks of public spaces. Certain recreational areas and programs provided might pose potential risks of injury to participants. However, we work to minimise these risks by adhering to safety standards. Additionally, we have procedures in
84 | Page
place to handle any disturbances to plants and animals during construction or maintenance work.
Reserves Investment Strategy
The Reserves Investment Strategy recognises the incredible opportunity we have to provide better quality green spaces to help address the effects of growth and intensification in our city. Within the Strategy you’ll find a proposed project list for the next 10 years. These projects will be funded through Reserve Financial Contributions, enacted under the Resource Management Act and District Plan. Budgets allocated to each project are estimates only and may change based on further community feedback and design.
Key PerformanceIndicators
OpenSpaces,ParksandReserves
PerformanceMeasure Reporting frequency Target 2024-25
Weprovideleisureandrecreationalopportunitiestoourcommunity:
Number of days Council owned/maintained artificial turf sports fields are closed (due to maintenance issues)
Number of days Council owned/maintained grass sports fields are closed (due to maintenance or drainage issues)
Target202434
Quarterly ≤ 20 days ≤ 20 days
Quarterly ≤ 10 days ≤ 10 days
85 | Page
Resident satisfaction with sports fields Annual ≥ 80% ≥ 80% Resident satisfaction with parks and reserves Annual ≥ 80% ≥ 80% Resident satisfaction with playgrounds Annual ≥ 80% ≥ 80%
Capital Projects -Open Spaces, Parks and Reserves
86 | Page
Capitalprojects OpenSpaces,Parks,&Reserves 2023/2024 2024/2025 2025/2026 2026/2027 2027/2028 2028/2029 2029/2030 2030/2031 2031/2032 2032/2033 2033/2034 ProjectDescription Forecast Draft Forecast Forecast Forecast Forecast Forecast Forecast Forecast Forecast Forecast $000 $000 $000 $000 $000 $000 $000 $000 $000 $000 $000 Capitalprojectstomeetadditionaldemand ReserveDevelopments - 7,750 4,800 2,750 4,450 5,550 300 200 100 50BellParkDevelopment 500 - - - - - - - - -BlackCreekreservedevelopment 270 - - - - - - - - -TreePlantingCityWide 30 - - - - - - - - -HighStreetPomarereservedevelopment 200 - - - - - - - - -DelaneyPark 400 - - - - - - - - -Capitalprojectstoreplaceexistingassets Seats&Bins 63 65 68 72 76 79 83 85 90 93 97 ParksBuildingsCapitalRenewals 2,105 1,097 307 325 667 1,022 136 182 600 1,558 838 AvalonParkPavilionRenewal 95 - - - 123 - 107 - 72 -ParksHardSurfacesRenewal 263 852 896 228 996 1,048 655 1,158 893 1,277 435 SportsgroundBuildingsRenewal 232 - - - - - - - - -Playgrounds 216 223 1,161 247 258 270 281 291 305 317 330 TrackRenewal 207 109 114 120 126 131 137 142 149 155 161 ParksSignage&Interpretation 32 33 65 37 70 39 41 42 44 46 47 KorohiwaBusBarnRenewal - 10 29 53 87 - - - - -HuttRecArtificialTurfRenewal - - - - 492 - - - - -HuttRecSandCarpetRenewal - - - 612 - - - - - -PetoneGrandstandRenewal - 200 200 2,000 - - - - - -OtherRenewalsProjects 20 - - - - - - - - -NaenaeBowlsRenewal - 1 22 28 300 - 321 - 68 - 29 RicohSportsCentreRenewal - - 78 28 254 - 72 53 253 - 45 Parks&ReservesDrainageRenewals - - - - - - - 1,146 - -Capitalprojectstoimprovelevelofservice Parks&GardensProtectionBollards 5 10 10 10 11 11 12 14 14 14 16 AvalonParkDevelopment - - - 117 - 1,417 - 140 - -WilliamsParkImprovements 447 - - - - - - - - -CarParkDevelopment - - - - 246 - - 140 - -WainuiomataGardenOfRemembrance 225 - - - - - - - - -JubileeParkDrainage - - 41 - - - - - - -MeadowbankReserveDevelopmentBelmont 228 - - - - - - - - -NewTracks&TrackUpgrades - - 111 - 123 - 134 - 145 - 241 PercyReserveSH2Development - - - 21 - 129 - 140 - -ValleyFloorReviewImplementation 640 - - - - 644 672 - 726 - 775 MountainBikePark 211 54 57 61 63 66 68 71 74 77 80 MinohFriendshipHouseImprovements - 1 38 13 74 1 40 - 58 - 29 ToiletsUpgrade - 500 - - - - - - - -NaenaeParkChangingRooms - - - - - - 1,344 - - -SportsvilleArtificialPlayingSurface - - 971 - - 2,575 - - 2,903 -MemorialParkSyntheticTurf&ChangingRooms - - - 278 - - - - - -NewCemeteryDevelopment,AkatarawaRoad 895 1,275 - - - - 3,348 - - -DecarbonisationEnergyConversion(Parks) - 218 222 114 - 119 607 - - -TaitaCemeteryImprovements - - 51 575 - 44 513 - 58 592PercySecenicReserveBoardwalk - - - 136 - - - - - -WainuiomataGardenofRemembranceImprovement - - - - - 44 614 - - - 48 Parks&ReserveDrainageImprovements - 1,080 1,405 1,788 799 1,066 1,328 1,355 310 473 482 Parks&ReservesSecurityImprovements - - 164 105 107 109 112 - - -7,284 13,479 10,813 9,717 9,321 14,363 10,926 5,159 6,861 4,652 3,654
ProspectiveStatement of ComprehensiveRevenueand Expense - Open Spaces, Parks and Reserves
Explanations of differences between the10-year plan 2024-2034 and the equivalent years of theAnnual Plan 2023-24 - Open Spaces, Parks and Reserves
Revenue - Open Spaces, Parks and Reserves
Revenue has increased by $7.3 million largely due to financial contributions for reserves assumed to continue at the actuals recovered in recent years and changes to fees and charges to offset rising costs across the activity.
Expenditure- Open Spaces, Parks and Reserves
Expenditure has increased by $3 million and is driven by the inclusion of $6 million for the Petone Wharf demolition plus cost escalations for operating
87 | Page
OPENSPACES,PARKS&RECREATION-PROSPECTIVESTATEMENTOFCOMPREHENSIVEREVENUEANDEXPENSE Fortheyearending30June Forecast Draftbudget Forecast Forecast Forecast Forecast Forecast Forecast Forecast Forecast Forecast 2024 2025 2026 2027 2028 2029 2030 2031 2032 2033 2034 $000 $000 $000 $000 $000 $000 $000 $000 $000 $000 $000 REVENUE Rates - - - - - - - - - -Usercharges 1,553 1,652 1,806 2,012 2,060 1,950 1,993 2,035 2,078 2,120 2,162 Operatingsubsidies - - - - - - - - - -Operatinggrants 6 6 6 6 6 7 7 7 7 7 7 Capitalsubsidies - - - - - - - - - -CapitalGrants 100 - - - - - - - - -Development&financialcontributions 2,500 3,000 3,000 3,000 3,000 3,000 3,000 3,000 3,000 3,000 3,000 Vestedassets - - - - - - - - - -Interestearned - - - - - - - - - -DividendsfromCCOs - - - - - - - - - -Gain/(loss)ondisposalofassets - - - - - - - - - -Otherrevenue 108 112 115 117 120 123 125 128 130 133 135 Totalrevenue 4,267 4,770 4,927 5,135 5,186 5,080 5,125 5,170 5,215 5,260 5,304 EXPENDITURE Employeecosts 969 1,097 1,135 1,076 1,103 1,130 1,159 1,188 1,217 1,248 1,279 Operatingcosts 17,033 14,973 15,128 18,552 15,046 15,334 15,793 16,241 16,770 17,687 16,369 Supportcosts/internalcharges 1,406 1,053 1,103 1,125 1,169 1,205 1,274 1,241 1,277 1,311 1,372 Interestexpenditure 1,046 1,746 1,930 2,440 2,633 2,920 3,191 2,995 2,727 2,235 1,527 Depreciation 3,397 3,992 4,409 5,060 5,798 6,073 6,456 6,928 6,128 6,134 6,613 Totalexpenditure 23,851 22,861 23,705 28,253 25,749 26,662 27,873 28,593 28,119 28,615 27,160 SURPLUS/(DEFICIT)BEFORETAX (19,584) (18,091) (18,778) (23,118) (20,563) (21,582) (22,748) (23,423) (22,904) (23,355) (21,856) TOTALCAPITALEXPENDITURE 7,284 13,478 10,813 9,717 9,320 14,364 10,925 5,159 6,861 4,652 3,654 PROSPECTIVEFUNDINGREQUIREMENT RATESFUNDINGREQUIREMENT Surplus/(deficit) (19,584) (18,091) (18,778) (23,118) (20,563) (21,582) (22,748) (23,423) (22,904) (23,355) (21,856) Addcapitalcontributions (2,600) (3,000) (3,000) (3,000) (3,000) (3,000) (3,000) (3,000) (3,000) (3,000) (3,000) Ratefundeddebt/(debtrepayment) - - - - - - - - - -Totalratesfundingrequirement (22,184) (21,091) (21,778) (26,118) (23,563) (24,582) (25,748) (26,423) (25,904) (26,355) (24,856) LOANFUNDINGREQUIREMENT Capitaltomeetadditionaldemand (1,400) (7,750) (4,800) (2,750) (4,450) (5,550) (300) (200) (100) (50)Capitaltoimprovelevelofservice (2,651) (3,138) (3,071) (3,218) (1,422) (6,224) (8,792) (1,859) (4,288) (1,156) (1,672) Capitaltoreplaceexistingassets (3,233) (2,590) (2,942) (3,749) (3,448) (2,590) (1,833) (3,100) (2,473) (3,446) (1,982) Lesscapitalcontributions 2,600 3,000 3,000 3,000 3,000 3,000 3,000 3,000 3,000 3,000 3,000 LessUHCCcapitalcontribution - - - - - - - - - -Lessdepreciation 3,397 3,992 4,409 5,060 5,798 6,073 6,456 6,928 6,128 6,134 6,613 Lessassetsales - - - - - - - - - -Lessratefundeddebtrepayment - - - - - - - - - -Totalloan(funding)/repayment (1,287) (6,486) (3,404) (1,657) (522) (5,291) (1,469) 4,769 2,267 4,482 5,959 TOTALFUNDINGREQUIREMENT (23,471) (27,577) (25,182) (27,775) (24,085) (29,873) (27,217) (21,654) (23,637) (21,873) (18,897)
budgets offset by reduction in depreciation and cost allocation for internal support activities.
Capital - Open Spaces, Parks and Reserves
Capital expenditure has decreased by $18 million based on investigation and updated cost estimates for the required capital work programme including removal of the Petone Wharf project.
88 | Page
Ngā herengatanga, auahatanga, akoranga me ngā mahi a te rēhia |
Connectivity, creativity, learning and recreation
Statements of ServicePerformance
What wedo
Council plays an important role in providing spaces and facilities that serve as hubs for connection, creativity, learning, and enjoyment. Our extensive network of swimming pools, fitness centres, art spaces, and museums form the beating heart of the communities they serve.
Council's Aquatic team enhances community wellbeing through six facilities. Services include swimming pools, fitness suites, Swim City Swim School, and related programs.
The facilities provide spaces where residents and visitors can recreate, relax, connect, improve fitness and health, build water confidence and the ability to swim, and have fun.
Why wedo it
Overall facilities contribute to enhancing cultural life, diversity, and wellbeing. They foster civic pride and promote strong community values. This focus on community strength and resilience ensures a sustainable and prosperous future for our city.
Council focuses on providing high-quality library services and museums stems from the belief that everyone should have access to information, knowledge, arts, and culture. By offering these resources, we aim to support and enrich individuals and the broader community.
89 | Page
Recognising the positive impact of recreation, sport, and fitness on people's lives, we ensure the provision of high-quality services at a cost that helps make them accessible for the entire community.
Aquatic and fitness facilities contribute to the wellbeing of our people and vitality of the city by:
• increasing social cohesion and people’s sense of belonging and healthy communities that can result from the social interaction that occurs at aquatic facilities.
• providing learn to swim programmes (particularly for children) which is considered a vital public service to promote safety and prevent accidental drowning.
Significant negativeeffects and mitigation
Activities that facilitate gatherings and occur in public spaces can sometimes have adverse effects, exposing participants to inherent risks. Certain pool programs we offer may potentially pose risks of injury to participants. However, these risks are minimized with the presence of trained staff. Systems are in place to regulate the rental and usage of community facilities, ensuring community safety.
Key PerformanceIndicators Connectivity,
90 | Page
PerformanceMeasure Reporting frequency Target 2024-25 Target202434 Weprovideourcommunitywithaccesstoaleisureandrecreationalopportunities: Number of pools whomet visitor number targets Quarterly 5 of5 6 of 6 Number of fitness suite members Quarterly ≥ 1,400 Greater than or equal to previous year Resident satisfaction with pools Annual ≥ 80% ≥ 80% Weenableaccessto arts andculture: Number of museums who met visitor number targets Quarterly 2 of 2 2 of 2 Number of arts and culture programmes delivered at museums Quarterly >200 >200 Resident satisfaction with museums Annual ≥ 80% ≥ 80%
creativity,learningandrecreation
Capital Projects -Connectivity, creativity, learning and recreation
91 | Page
Capitalprojects Connectivity,Creativity,Learning,&Recreation 2023/2024 2024/2025 2025/2026 2026/2027 2027/2028 2028/2029 2029/2030 2030/2031 2031/2032 2032/2033 2033/2034 ProjectDescription Forecast Draft Forecast Forecast Forecast Forecast Forecast Forecast Forecast Forecast Forecast $000 $000 $000 $000 $000 $000 $000 $000 $000 $000 $000 Capitalprojectstoreplaceexistingassets DowseCarpetsandSoftFurnishingsGalleryandOffice - 20 46 - 35 33 112 - 76 -DowseOfficeFurnitureandEquipment 42 - 28 27 54 - 73 46 80 -DowseMuseumRenewal - 132 356 311 160 8 321 424 63 12 169 DowseGalleryLighting 21 44 - 68 - 83 - 112 - 103 0 PetoneSettlersMuseumBuilding&PlantRenewal 158 4 9 55 53 6 245 10 26 - 19 OtherPoolProjects 440 290 2,089 532 256 109 383 146 193 107 244 HuiaPoolFitnessSuiteEquipmentReplacement - - - - 297 - - - - 329StokesValleyPoolRoofReplacement 679 - - - - - - - - -FurnitureandEquipmentReplacementProgrammeLibraries 116 350 62 46 124 48 67 50 135 52 73 ReplaceLibraryShelving 53 120 123 23 160 55 25 25 26 26 27 LibrariesStockReplacement 711 680 695 711 727 743 759 774 790 805 820 LibrariesInteriorandExteriorRenewal 84 - - - - - - - - -HuiaPoolBoilerReplacement,Hydro/LTSPool - - 998 - - - - - - -PetoneSettlersMuseumExhibitionFurnitureandFittings - - - - - 59 - - 76 - 13 LittleTheatreRenewal - 28 123 105 119 2 167 83 58 - 74 PetoneLibraryRenewal - - 200 4,800 5,000 - - - - -MoeraLibraryRenewal 1,214 22 56 34 9 4 6 4 - 1 8 EastbournePoolRenewals - 10 20 49 75 5 551 - 50 - 18 StokesValleyPoolRenewals - 43 101 1,606 384 123 369 365 122 31 201 NaenaePoolRenewals- - - - - - - - 793NaenaeLibraryRenewal - 3 18 29 107 1 63 57 26 0 24 WainuiomataLibraryRenewal - 24 42 22 223 0 81 1 85 1 27 Capitalprojectstoimprovelevelofservice DowseCollectionStorageUpgrade 213 - - - - 109 - - - 139DowseNewArtworks 47 54 56 63 64 71 73 81 82 90 92 DowseHeatPump 890 - - - - - - - - -LittleTheatreImprovements - - - 102 - - - - 190 -LittleTheatreSoundandLightingImprovements - - 67 - - - 36 - - 193McKenziePoolRenewals - 50 142 98 167 12 251 47 75 39 86 PoolsOtherImprovementProjects - 136 138 - 145 - - 154 157 200NaenaePool&FitnessRebuild 28,949 2,271 6 - - - - - - -RFIDRoboticReturnsSorter 165 200 - - - - - 228 - -LibrariesBuildingsImprovements 47 50 51 52 53 55 112 57 58 59 60 CivicEventsCentreImprovements 212 50 99 49 49 247 247 99 867 193 197 EastbourneLibrary/CommunityHubBuildingImprovements - 28 98 98 27 6 83 1 19 1 32 NaenaeFitnessSuiteEquipmentPurchase 158 - - - - - 182 - - -PetoneSettlersMuseumNewLightingandFurnishings - - - - - - - - - 129WainuiomataPoolRenewals - 19 298 359 66 472 117 147 34,918 24 141 SelfScanningMachinesPurchase - - - - - - 279 - - -StokesValleyPoolHeatPump - - - - 609 - - - - -Decarbonisationprojects 248 490 - - 116 - 1,275 - - -WarMemorialLibraryRenewal - 1 - 3 160 3 7 3 - 1,131 6 34,447 5,117 5,920 9,245 9,241 2,256 5,887 2,912 38,170 4,457 2,330
ProspectiveStatement of ComprehensiveRevenueand Expense -
Connectivity, creativity, learning and recreation
Explanations of differences between the10Year Plan 2024-2034 and the equivalent years of theAnnual Plan 2023-24 - Connectivity, creativity, learning and recreation
Revenue - Connectivity, creativity, learning and recreation
Revenue has increased by $3 million largely due to changes to fees and charges to offset rising costs across the activity area.
Expenditure- Connectivity, creativity, learning and recreation
Expenditure has increased by $22 million driven by additional resourcing put in place, higher interest and depreciation costs linked to the capital spend, offset by reduction in cost allocation for internal support activities.
92 | Page
CONNECTIVITY,CREATIVITY,LEARNING.&RECREATION-PROSPECTIVESTATEMENTOFCOMPREHENSIVEREVENUEANDEXPENSE Fortheyearending30June Forecast Draftbudget Forecast Forecast Forecast Forecast Forecast Forecast Forecast Forecast Forecast 2024 2025 2026 2027 2028 2029 2030 2031 2032 2033 2034 $000 $000 $000 $000 $000 $000 $000 $000 $000 $000 $000 REVENUE Rates - - - - - - - - - -Usercharges 4,123 5,009 6,025 6,170 6,318 6,464 6,607 6,747 6,890 7,031 7,180 Operatingsubsidies - - - - - - - - - -Operatinggrants 36 - - - - - - - - -Capitalsubsidies - - - - - - - - - -CapitalGrants 17,650 2,700 - - - - - - - -Development&financialcontributions - - - - - - - - - -Vestedassets - - - - - - - - - -Interestearned - - - - - - - - - -DividendsfromCCOs - - - - - - - - - -Gain/(loss)ondisposalofassets - - - - - - - - - -Otherrevenue 735 738 754 719 736 752 768 783 799 814 830 Totalrevenue 22,544 8,447 6,779 6,889 7,054 7,216 7,375 7,530 7,689 7,845 8,010 EXPENDITURE Employeecosts 9,330 10,603 11,766 12,373 12,553 12,867 13,188 13,518 13,856 14,203 14,557 Operatingcosts 6,735 7,513 7,981 8,090 8,188 8,384 8,517 8,707 8,886 9,069 9,260 Supportcosts/internalcharges 7,720 7,117 7,081 7,335 7,491 7,758 8,119 8,287 8,207 8,426 8,761 Interestexpenditure 3,220 4,495 4,420 5,231 5,635 5,453 5,624 5,365 6,416 5,676 4,456 Depreciation 4,261 6,315 7,742 8,018 8,827 8,951 9,195 9,891 10,462 10,968 11,670 Totalexpenditure 31,266 36,043 38,990 41,047 42,694 43,413 44,643 45,768 47,827 48,342 48,704 SURPLUS/(DEFICIT)BEFORETAX (8,722) (27,596) (32,211) (34,158) (35,640) (36,197) (37,268) (38,238) (40,138) (40,497) (40,694) TOTALCAPITALEXPENDITURE 34,447 5,117 5,920 9,245 9,241 2,256 5,887 2,913 38,171 4,458 2,331 PROSPECTIVEFUNDINGREQUIREMENT RATESFUNDINGREQUIREMENT Surplus/(deficit) (8,722) (27,596) (32,211) (34,158) (35,640) (36,197) (37,268) (38,238) (40,138) (40,497) (40,694) Addcapitalcontributions (17,650) (2,700) - - - - - - - -Ratefundeddebt/(debtrepayment) - - - - - - - - - -Totalratesfundingrequirement (26,372) (30,296) (32,211) (34,158) (35,640) (36,197) (37,268) (38,238) (40,138) (40,497) (40,694) LOANFUNDINGREQUIREMENT Capitaltomeetadditionaldemand - - - - - - - - - -Capitaltoimprovelevelofservice (30,929) (3,348) (956) (825) (1,457) (976) (2,664) (817) (36,366) (2,198) (614) Capitaltoreplaceexistingassets (3,518) (1,769) (4,964) (8,420) (7,784) (1,280) (3,223) (2,096) (1,805) (2,260) (1,717) Lesscapitalcontributions 17,650 2,700 - - - - - - - -LessUHCCcapitalcontribution - - - - - - - - - -Lessdepreciation 4,261 6,315 7,742 8,018 8,827 8,951 9,195 9,891 10,462 10,968 11,670 Lessassetsales - - - - - - - - - -Lessratefundeddebtrepayment - - - - - - - - - -Totalloan(funding)/repayment (12,536) 3,898 1,822 (1,227) (414) 6,695 3,308 6,978 (27,709) 6,510 9,339 TOTALFUNDINGREQUIREMENT (38,908) (26,398) (30,389) (35,385) (36,054) (29,502) (33,960) (31,260) (67,847) (33,987) (31,355)
Capital - Connectivity, creativity, learningand recreation
Capital expenditure has increased by $41 million based on investigation of asset management requirements and updated cost estimates for the required programme of works.
93 | Page
Kāwanatanga, ko te rautaki me ngā kīwei o te kete | Governance, strategy and partnerships
Statements of ServicePerformance
What wedo
Council plays a crucial role in local democracy, defined by the Local Government Act (2002), and has two primary objectives;
• Firstly, we are committed to enabling democratic local decision-making.
• Secondly, we are dedicated to promoting the wellbeing of communities through a sustainable development approach.
Our aim is to empower diverse communities to participate actively in local decisions. This is how we ensure democratic processes are upheld and remain accountable to our community.
We provide elected members with the essential support and professional advice they need to make sound decisions for the city. Our dedication to democratic principles isn’t just a legal requirement; but a representation of our aspirations for a city that’s inclusive and promotes active public involvement.
Why wedo it
Council’s governance activities are driven by a commitment to enhancing the wellbeing of our communities both in the present and for future generations. The Local Government Act (2002) requires us to recognise and respect the principles of the Treaty of Waitangi, emphasising the Crown's responsibility to incorporate these principles. As a result, our partnership with Mana Whenua is essential in meeting our obligations and fostering a city where everyone thrives.
To achieve these goals, we engage in comprehensive governance-related services, strategic planning, policy development, and continuous monitoring and reporting. Our work aims not only to fulfil legal obligations but to create an
94 | Page
inclusive, resilient environment that supports the diverse needs of our community members.
Key PerformanceIndicators
Governance,strategyandpartnerships
Ourcommunityisprovidedwiththeinformationtheyrequireto participateinthedemocratic process:
Percentage
Council agendas made available to the public within statutory timeframes (four clear working days under Council's standing orders)
Residents feel they have enough information to participate in democratic process
Capital Projects -Governance, strategy and partnerships
There are no capital projects associated with this activity.
95 | Page
PerformanceMeasure Reporting frequency Target 2024-25 Target 2024-34
of
Quarterly 100% 100% Resident satisfaction with access tothe decision-
Annual ≥ 80% ≥ 80%
Annual ≥ 80% ≥ 80%
making process
ProspectiveStatement of ComprehensiveRevenueand Expense – Governance, strategy and partnerships
Explanations of differences between the10-year plan 2024-2034 and the equivalent years of theAnnual Plan 2023-24 - Governance,strategy and partnerships
Revenue
No material variance.
Expenditure
Expenditure has increased by $13.2 million and is driven by higher operating cost allocation for internal support activities, higher employee costs and cost escalations across other operating costs.
96 | Page
GOVERNANCE,STRATEGY&PARTNERSHIPS-PROSPECTIVESTATEMENTOFCOMPREHENSIVEREVENUEANDEXPENSE Fortheyearending30June Forecast Draftbudget Forecast Forecast Forecast Forecast Forecast Forecast Forecast Forecast Forecast 2024 2025 2026 2027 2028 2029 2030 2031 2032 2033 2034 $000 $000 $000 $000 $000 $000 $000 $000 $000 $000 $000 REVENUE Rates - - - - - - - - - -Usercharges - - - - - - - - - -Operatingsubsidies - - - - - - - - - -Operatinggrants - - - - - - - - - -Capitalsubsidies - - - - - - - - - -CapitalGrants - - - - - - - - - -Development&financialcontributions - - - - - - - - - -Vestedassets - - - - - - - - - -Interestearned - - - - - - - - - -DividendsfromCCOs - - - - - - - - - -Gain/(loss)ondisposalofassets - - - - - - - - - -Otherrevenue - - 230 - - 246 - - 261 -Totalrevenue - - 230 - - 246 - - 261 -EXPENDITURE Employeecosts 1,146 1,403 1,477 1,503 1,541 1,606 1,619 1,659 1,729 1,743 1,787 Operatingcosts 1,972 2,188 2,748 2,270 2,336 2,939 2,423 2,487 3,122 2,569 2,634 Supportcosts/internalcharges 4,083 4,669 4,922 5,063 5,089 5,297 5,449 5,477 5,593 5,708 5,792 Interestexpenditure - - - - - - - - - -Depreciation (28) 6 3 - - - - - - -Totalexpenditure 7,173 8,266 9,150 8,836 8,966 9,842 9,491 9,623 10,444 10,020 10,213 SURPLUS/(DEFICIT)BEFORETAX (7,173) (8,266) (8,920) (8,836) (8,966) (9,596) (9,491) (9,623) (10,183) (10,020) (10,213) TOTALCAPITALEXPENDITURE - - - - - - - - - -PROSPECTIVEFUNDINGREQUIREMENT RATESFUNDINGREQUIREMENT Surplus/(deficit) (7,173) (8,266) (8,920) (8,836) (8,966) (9,596) (9,491) (9,623) (10,183) (10,020) (10,213) Addcapitalcontributions - - - - - - - - - -Ratefundeddebt/(debtrepayment) - - - - - - - - - -Totalratesfundingrequirement (7,173) (8,266) (8,920) (8,836) (8,966) (9,596) (9,491) (9,623) (10,183) (10,020) (10,213) LOANFUNDINGREQUIREMENT Capitaltomeetadditionaldemand - - - - - - - - - -Capitaltoimprovelevelofservice - - - - - - - - - -Capitaltoreplaceexistingassets - - - - - - - - - -Lesscapitalcontributions - - - - - - - - - -LessUHCCcapitalcontribution - - - - - - - - - -Lessdepreciation (28) 6 3 - - - - - - -Lessassetsales - - - - - - - - - -Lessratefundeddebtrepayment - - - - - - - - - -Totalloan(funding)/repayment (28) 6 3 - - - - - - -TOTALFUNDINGREQUIREMENT (7,201) (8,260) (8,917) (8,836) (8,966) (9,596) (9,491) (9,623) (10,183) (10,020) (10,213)
97 | Page
rangatōpū
Corporate
Capital Projects -CorporateServices Operating Projects over $250k per year - CorporateServices Capitalprojects CorporateServices 2023/2024 2024/2025 2025/2026 2026/2027 2027/2028 2028/2029 2029/2030 2030/2031 2031/2032 2032/2033 2033/2034 ProjectDescription Forecast Draft Forecast Forecast Forecast Forecast Forecast Forecast Forecast Forecast Forecast $000 $000 $000 $000 $000 $000 $000 $000 $000 $000 $000 Capitalprojectstoreplaceexistingassets PavilionRenewal - 33 45 27 211 1 210 5 1,168 - 37 CivicAdministrationBuildingRenewal 11 7 74 124 272 52 271 159 162 309 156 SystemRenewal - 120 61 - - - 134 68 - - 145 Hardware–ITInfrastructure 500 532 562 523 810 879 837 918 871 1,322 904 ContingentFacilitiesManagementFund 1,538 1,088 1,112 1,138 1,164 1,190 1,215 1,239 1,264 1,288 1,312 Defibrillators 43 11 12 24 12 12 25 13 13 27 40 PetoneClockTowerRenewal - - 3 2 - 1 12 - - - 1 Capitalprojectstoimprovelevelofservice Other(IT)Projects 105 57 63 53 849 816 882 780 930 513 952 SystemUpgrades 74 - - - - - - - - -FacilitiesSeismicStrengthening 1,713 - - - - - - - - -VehiclePurchase 726 828 1,629 741 803 828 1,778 807 872 896 1,921 InternetOnlineServices - 200 204 209 214 219 223 228 232 237 241 ThePavilionImprovements 257 - 145 - - 107 - - - -4,967 2,877 3,909 2,841 4,335 4,106 5,587 4,216 5,512 4,592 5,709 CorporateServices 2023/2024 2024/2025 2025/2026 2026/2027 2027/2028 2028/2029 2029/2030 2030/2031 2031/2032 2032/2033 2033/2034 Project Forecast Draft Budget Forecast Forecast Forecast Forecast Forecast Forecast Forecast Forecast Forecast Description $000 $000 $000 $000 $000 $000 $000 $000 $000 $000 $000 GoDigitalProgram 3,972 4,463 1,232 1,046 - - - - - -Total 3,972 4,463 1,232 1,046 - - - - - -Operating projects
Ratonga
|
Services
ProspectiveStatement of ComprehensiveRevenueand Expense - Corporate Services
Explanationsof differences between the 10-year plan 2024-2034 and the equivalent years of the Annual Plan 2023-24 - Corporate Services
Revenue - Corporate Services
Revenue has increased by $614 million largely due to assumed rates revenue increases.
Expenditure -Corporate Services
Expenditure has decreased by $11 million and is driven by cost savings assumed in budgets.
Capital -Corporate Services
Capital expenditure has increased by $0.9 million based on an updated capital programme.
98 | Page
CORPORATESERVICES-PROSPECTIVESTATEMENTOFCOMPREHENSIVEREVENUEANDEXPENSE Fortheyearending30June Forecast Draftbudget Forecast Forecast Forecast Forecast Forecast Forecast Forecast Forecast Forecast 2024 2025 2026 2027 2028 2029 2030 2031 2032 2033 2034 $000 $000 $000 $000 $000 $000 $000 $000 $000 $000 $000 REVENUE Rates 155,612 183,622 207,309 234,882 264,007 295,424 330,579 357,356 386,302 417,592 451,417 Usercharges 1,436 1,685 1,723 1,762 1,803 1,842 1,881 1,919 1,957 1,994 2,032 Operatingsubsidies - - - - - - - - - -Operatinggrants 11 11 11 11 12 12 12 12 13 13 13 Capitalsubsidies - - - - - - - - - -CapitalGrants - - - - - - - - - -Development&financialcontributions - - - - - - - - - -Vestedassets - - - - - - - - - -Interestearned 3,238 4,200 2,939 2,988 3,041 3,106 3,184 3,231 3,283 3,358 3,435 DividendsfromCCOs 204 204 208 213 218 223 228 232 237 241 246 Gain/(loss)ondisposalofassets - - - - - - - - - -Otherrevenue 400 407 416 426 435 445 454 463 473 514 523 Totalrevenue 160,901 190,129 212,606 240,282 269,516 301,052 336,338 363,213 392,265 423,712 457,666 EXPENDITURE Employeecosts 15,329 17,723 17,953 18,593 19,046 19,523 20,010 20,510 21,023 21,549 22,086 Operatingcosts 10,344 11,042 9,741 9,570 8,311 8,318 8,349 7,790 7,028 6,844 6,426 Supportcosts/internalcharges (29,324) (33,761) (34,207) (35,059) (35,766) (36,926) (38,534) (38,581) (38,688) (39,570) (40,935) Interestexpenditure 3,550 3,778 4,706 3,541 3,650 3,705 3,905 3,970 4,096 4,157 4,240 Depreciation 1,064 1,091 1,852 2,375 2,975 3,221 3,693 3,835 3,320 3,421 4,098 Totalexpenditure 963 (127) 45 (980) (1,784) (2,159) (2,577) (2,476) (3,221) (3,599) (4,085) SURPLUS/(DEFICIT)BEFORETAX 159,938 190,256 212,561 241,262 271,300 303,211 338,915 365,689 395,486 427,311 461,751 TOTALCAPITALEXPENDITURE 4,967 2,877 3,910 2,841 4,335 4,106 5,586 4,216 5,512 4,591 5,709 PROSPECTIVEFUNDINGREQUIREMENT RATESFUNDINGREQUIREMENT Surplus/(deficit) 159,938 190,256 212,561 241,262 271,300 303,211 338,915 365,689 395,486 427,311 461,751 Addcapitalcontributions - - - - - - - - - -Ratefundeddebt/(debtrepayment) 42,755 32,103 28,828 26,141 22,430 19,196 6,602 (1,117) (19,474) (38,249) (55,578) Totalratesfundingrequirement 202,693 222,359 241,389 267,403 293,730 322,407 345,517 364,572 376,012 389,062 406,173 LOANFUNDINGREQUIREMENT Capitaltomeetadditionaldemand - - - - - - - - - -Capitaltoimprovelevelofservice (2,876) (1,085) (2,041) (1,003) (1,866) (1,970) (2,883) (1,814) (2,034) (1,646) (3,115) Capitaltoreplaceexistingassets (2,091) (1,792) (1,869) (1,838) (2,469) (2,136) (2,703) (2,402) (3,478) (2,945) (2,594) Lesscapitalcontributions - - - - - - - - - -LessUHCCcapitalcontribution - - - - - - - - - -Lessdepreciation 1,064 1,091 1,852 2,375 2,975 3,221 3,693 3,835 3,320 3,421 4,098 Lessassetsales 436 451 210 863 455 493 507 1,088 494 533 548 Lessratefundeddebtrepayment (42,755) (32,103) (28,828) (26,141) (22,430) (19,196) (6,602) 1,117 19,474 38,249 55,578 Totalloan(funding)/repayment (46,222) (33,438) (30,676) (25,744) (23,335) (19,588) (7,988) 1,824 17,776 37,612 54,515 TOTALFUNDINGREQUIREMENT 156,471 188,921 210,713 241,659 270,395 302,819 337,529 366,396 393,788 426,674 460,688
Ngā whakatau me ngā whakapae o te kawe ratonga Service performance judgements and assumptions
PBE FRS48 ServicePerformanceReportingstandard Introduction
Council is responsible for democratic and effective decision making in Te Awa Kairangi ki Tai / Lower Hutt. Council is also bound by the Local Government Act 2002 to promote the social, economic, environmental, and cultural wellbeing of the city's current and future communities.
How Council selects performancemeasures
In the Council's 10-year plan, significant steps have been taken to evaluate their performance in various ways. This evaluation involves summarising overall performance, assessing the effectiveness of different activities, and providing yearly reports
One major decision for the Council is ensuring that the goals set for our services align with the criteria used to gauge our performance. Council closely examines how these goals and measurements align to ensure that the selected measurements truly reflect the quality of services within the community.
Council don't make these decisions in isolation. They seek input and feedback from people in our community, including residents, those who pay local rates, local boards, and other communities. They consider this input about our services and how to measure their quality. This feedback is collected during the LongTerm Plan, Annual Plan consultation process and through annual Resident Satisfaction Surveys.
The Local Government Act (2002) prescribes specific rules that require standard measurements for different types of activities. This allows people to compare services across Council. Council also takes advice from the Department of
99 | Page
Internal Affairs (DIA) on how to measure certain things following specific guidelines, (such as processing a certain percentage of building permits and resource consents within 20 days). These decisions are essential for ensuring that our method of assessing our services aligns with community preferences, our objectives, and the law.
In addition to the selection of performance measurements, Council also make decisions about how they measure, compile, and present information about the quality of our services. They have a consistent way of reviewing and selecting performance measures. This method looks at why Councils are spending the money they receive now and what they aim to accomplish with it. It helps determine performance measures. They check each measure using certain rules that make sense and show our progress well.
Council have taken steps to guarantee that these performance measures sufficiently contribute to tracking our progress in achieving the objectives outlined in the 10-year long plan. The Council's Service Performance Indicators are found in the "Our Performance" section.
Resident satisfaction surveys
Council uses surveys to help us understand what customers, local residents, and the community think about their services. They are different from surveys that only ask if people are happy with our specific services. Creating these surveys is a meticulous process. Skilled professionals, craft them using the most effective survey methods. Council ensure that the questions are straightforward, avoiding any bias that might influence people's responses. In situations where it's crucial to maintain complete fairness, Council collaborate with impartial organisations to conduct the surveys.
The insights gained from these surveys serve enhance our procedures and making our services even better in the times ahead. Council takes great care in selecting the individuals to participate in our surveys, aiming for a diverse representation that closely mirrors the community of Te Awa Kairangi ki Tai Lower Hutt. They may make slight adjustments to survey results to ensure accurate reflection of the characteristics of the targeted groups. Additionally, when applicable, they employ advanced statistical techniques to assess the significance of survey findings. In cases where the results exhibit uncertainty due to low response rates, Council is transparent in communicating this to ensure full awareness among their audience.
100 | Page
Council use a number of expert survey techniques to make sure their surveys are as good as they can be. For example, surveys about their services are done more frequently because they want to keep improving their services.
Surveys seeking generally opinions are done once a year to get an overall picture of what people think at that particular time. Council also runs surveys with the general population, like the Quality of Life survey, to find out what people think about life in Te Awa Kairangi ki Tai Lower Hutt.
These surveys see the effectiveness of how services are and how they impact people's lives. These surveys help understand how well services are performing and give an idea on how to make them better. It helps to make good decisions based on real information from the community.
How Council report on performancemeasures and results
The year-end results for performance measures are reported in annual reports. Results are reported in a table under the heading Key Performance Indicators for each activity area. Comparative results are provided for the prior year to give a comparison at a similar point in time and show trends. Where a standard for a performance measure has not been met, or there is a significant variance, an explanation is included.
External implications for statements about performance
The introduction of the (the standard) brings more rigorous requirements for reporting service performance to enhance accountability and decision making. External factors beyond an entity’s control, such as government policy changes, travel restrictions, and economic conditions, can influence service performance results.
Hutt City Council utilises non financial Key Performance Indicators (KPIs) based on the 2024-2034 Long Term Plan, ensuring alignment with Council priorities and performance improvement. These KPI’s measure outcomes directly controllable by the Council.
PBE FRS 48 encourages presentation on clear and meaningful service performance information alongside financial statements, emphasising the application of qualitative characteristics and constraints in reporting. Reporting consistency and the disclosure of significant judgements affecting performance information are critical aspects of the Standard. HCC's impact assessment highlights expected changes and required disclosures due to these new reporting standards.
101 | Page
Disclosureof key judgements for 2024-34
In our previous annual reports, Council not only included disclosures about Key Performance Indicators (KPIs), but they also provided additional information on non-financial matters. This included details about the number of complaints received regarding water supply, wastewater, and stormwater KPIs, which were assessed by external auditors. Council also address concerns related to the reliability of the water supply, particularly regarding the percentage of water loss.
The report emphasised the Government's Three Waters Reform program and discussed uncertainties related to measuring greenhouse gas emissions. Council continues these disclosures and have included other important judgments and recommendations from auditors. This involves sharing information about our reasoning behind selecting specific KPIs, among other relevant matters.
Entities share the important decisions they make when reporting on their performance according to specific rules. Several factors determine when these decisions are shared, including how well the performance information aligns with the entity's goals and strategies, its internal consistency, and the level of freedom the entity possesses in selecting and presenting this information.
Other factors include the influence of certain attributes, such as importance and cost, and how user input affects the reporting. The entity also explains the decisions made when comparing past information or describing various elements and how they select measures and present their performance data.
Statement of compliance
This plan of the Hutt City Council has been prepared in accordance with the requirements of the LGA which includes the requirement to comply with New Zealand generally accepted accounting practice (NZ GAAP).
The Hutt City Council service performance has been prepared in accordance with the Tier 1 PBE financial reporting standards, which have been applied consistently throughout the period and complies with PBE financial reporting standards.
102 | Page
Ngā rautaki, ngā kaupapa here, me
ngā whakapae - Strategies, policies and assumptions
103 | Page
Significant forecasting assumptions
Assumption Risk Level of uncertainty
Post COVID-19 environmental impacts
The Long Term Plan is prepared on the basis that Council services are operating in an environment not impacted directly by COVID-19.
While COVID-19 itself is no longer a key risk, there are ongoing impacts of Covid such as increased inflationary pressure, resourcing shortages, higher insurance costs, supply chain issues and rising interest rates across the global economic environment This is exacerbated by the impacts of the changing climate.
Specific key assumptions have been made around interest rates, inflation, climate change and insurance costs related to natural disasters below.
Disruption caused by COVID-19 or a similar pandemic will result in changes or closure of Council operations, resulting in reduced revenue or delays in projects.
Wider economic disruption will impact the affordability of rates and levels of nonpayment.
Low
Reason for the uncertainty
Pandemic events are by nature unanticipated; however any uncertainty will be higher in the short term and decrease over time.
Financial impact of the uncertainty
Disruption to Council operations may result in reduced revenue from fees to fund Council activities.
Project delays may result in challenges on delivering project timeframes and budgets.
104 | Page
Assumption Risk Level of uncertainty Reason for the uncertainty Financial impact of the uncertainty
Inflation
Annual inflationary increases are based on the annual Local Government Cost Indices (LGCI), as published in the Final October 2023 BERL Report. LGCI for each year is detailed below.
Actual LGCI for the year significantly differs from that included in the budgets.
Moderate The LGCI estimates used are the forecasts issued by BERL in 2022.
Employee cost assumptions
The salary increase assumption is 4.5%, 3.5% and 3.5% for the first three years of the Long Term Plan with 2.5% for years 4-10. This is to enable Council to retain staff and meet market conditions as well as our obligations as a Living Wage accredited employer. This is offset with a vacancy savings assumption of 6%.
Growth Council projections for income from rates revenue include an
The actual employee costs are significantly different from the projected costs or vacancy savings are not realised.
Moderate Uncertainty exists as the ability to attract and retain staff is dictated by the labour market conditions.
Unanticipated inflationary pressure could arise outside of the forecast LGCI range which is not included in the Long-term Plan 2024-2034 resulting in higher costs to deliver services or projects.
The actual rates for growth are significantly
Moderate Uncertainty exists as the projected increases in population and the
Higher employee costs or lower vacancy savings will result in unbudgeted financial pressures.
Rates of growth that vary significantly from the assumed level will result in
105 | Page
Year 2024/2 5 2025/2 6 2026/27 2027/2 8 2028/2 9 2029/3 0 2030/31 2031/32 2032/3 3 2033/3 4 LGCI % 3.4% 2.20% 2.30% 2.30% 2.20% 2.10% 2.00% 2.00% 1.9% 1.9%
Assumption Risk Level of uncertainty
allowance for growth and inflation. Average growth of 1.1% per annum in the rating base is assumed in year 1 with 0.9% in out years. This is considered to be a reasonable estimate given population growth forecasts and increases in the number of households in Lower Hutt.
Population growth
The population of the city at the 2018 Census was 104,532.
Our current population at the 50th percentile is estimated at 113,034 (8% increase) and is projected to reach 125,000 around 2033 and 149,760 in 2053.
Interest rates
The long-term cost of borrowing is assumed to be an average of 5% through the period of the Long-term Plan.
Due to the volatility in market conditions this will be reviewed and updated throughout the planning process.
different from the projected rates of growth.
Reason for the uncertainty
associated number of houses may not be realised.
Financial impact of the uncertainty
unbudgeted financial pressures.
Population growth rates exceed or are less than forecast.
Moderate
Uncertainty exists as the projected increases in population and the associated number of houses may not be realised.
Rates of growth that vary significantly from the assumed level will result in unbudgeted financial pressures.
Interest rates and swap rates are significantly different from those budgeted.
Moderate Council has interest rate swaps in place to minimise the fluctuation of interest rate movements. As debt projections are forecast to increase significantly over the 10 year period there will be further interest rate swaps to be put in place; there is uncertainty about the future market conditions that will exist.
Higher interest rates provide the ability to earn higher income from cash holdings. Higher interest rates may lead to higher interest cost on debt.
Based on Council’s proposed borrowings profile, a 0.1% movement in interest rates will increase/decrease annual interest expense by between $500k to just over $1M per annum across the 10-year period of this plan.
The impact of this annual change would translate to an indicative rates impact of around 0.4% - 0.7%.
106 | Page
Assumption Risk Level of uncertainty
Natural disasters and insurance costs
Council has comprehensive insurance policies, which are designed to provide substantial, but not total, cover from the financial impact of natural disasters. The level of insurance cover is calculated by extensive loss modelling, which estimates the maximum probable loss.
Council collectively purchases insurance with the Wellington Councils Insurance Group (includes Kāpiti Coast District, Porirua City, Upper Hutt City and Greater Wellington Regional Councils).
Asset revaluation
Council is planning to revalue asset classes in May 2024 in accordance with its accounting policies, and the estimated results of the revaluation have been applied to financial forecasts from 1 July 2025.
Council assesses the carrying value of its revalued assets annually to ensure they do not differ materially from the assets’ fair value.
The damage exceeds the cover obtained by Council and its ability to fund the repair/reconst ruction out of normal budgetary provisions. The cost of insurance increases more than budgeted.
Reason for the uncertainty
Moderate The timing or scale of a natural disaster event cannot be predicted. Should an event occur, there is uncertainty over whether the city is able to recover sufficiently or quickly enough in order to prevent long-term adverse effects on the population or local economy.
Financial impact of the uncertainty
The damage exceeds the cover obtained by Council and its ability to fund the repair/reconstruction out of normal budgetary provisions. The cost of insurance increases more than budgeted.
Asset revaluations differ from those budgeted; depreciation charges resulting may differ.
Moderate
Market buoyancy and property pricing influences the value of the property assets. Contract and construction prices influence the value of infrastructure assets.
A higher level of asset valuation means more depreciation to use to fund asset renewals and some improvements.
Lower levels of valuation and depreciation reduce Council’s ability to fund capital from depreciation and place more reliance on funding improvements from other funding mechanisms, such as debt or rates.
Depreciation rates are contained in accounting policies
107 | Page
Assumption Risk Level of uncertainty Reason for the uncertainty Financial impact of the uncertainty
Revaluations are carried out every three years and this is factored into the financial projections based on an estimated rate of 5% based on information received from our valuers. For further information see council’s accounting policies.
Asset sales
A small amount of asset sales is planned for surplus land following completion of Council projects.
Asset lives
The estimated useful lives of significant assets will be as shown in the Statement of Accounting Policies. The assets will continue to be revalued every three years. It is assumed that assets will be replaced at the end of their useful life.
Ranges in average ages relate to the variability of component parts of assets and changing material and design of assets over time.
Property prices are higher or lower than the planned sales amount
Assets wear out earlier or later than estimated.
Moderate Market buoyancy and property pricing influences the value of the property assets.
A higher sales price would result in a gain on the sale made by the Council. Lower prices would result in greater costs having to be absorbed by rates.
ModerateLow
The level of certainty of useful lives of assets ranges across different asset types.
Underground assets that are not easily accessible have lower levels of confidence on their current condition and therefore expected remaining useful lives whereas aboveground assets have more certainty on their condition assessment and the useful life.
Depreciation and interest costs would increase if capital expenditure was required earlier than anticipated.
108 | Page
Assumption Risk Level of uncertainty
Asset condition
The condition of the network is expected to improve over the period of the 10 Year Plan.
Assumptions have been made regarding the average useful lives (per assumption above) and remaining lives of the asset groups, based on the current local knowledge and experience, asset condition information and historical trends.
Sources of funds
See Council’s Revenue and Financing Policy, included in the 10 Year Plan 20242034.
Detailed condition assessments for underground three waters assets may reveal that they have aged faster than our theoretical modelling anticipates.
Moderate
Reason for the uncertainty Financial impact of the uncertainty
By their nature underground assets are not visible and therefore condition information of these assets is not easily obtainable.
In the Long Term Plan additional funding continues to be assigned for investigative works to ensure we have a sufficient understanding of our underground assets.
Assets that have aged faster than planned may result in the requirement for renewal work to be brought forward to avoid the impact of asset failures.
NZ Transport Agency - Waka Kotahi
The Waka Kotahi New Zealand Transport Agency subsidy is 51% for both operating and capital works. For projects not fully subsidised by NZTA, a lower subsidy applies.
There is uncertainty around funding priorities based on the recent change in government.
Current funding patterns and subsidy percentages may change during the life of the Long Term Plan.
High
The impact of funding priorities on projects may change criteria based on the Government Policy Statement on land transport (GPS) which is not expected to be finalised ahead of adoption of the Long Term Plan 2024-34
Any reduction in subsidy rate would lead to a reduction in the work programme, reprioritisation of projects or Council having to fund a higher share of the costs.
109 | Page
Assumption Risk
Fees and charges
Fees and charges are expected to be increased at a minimum to cover the costs of operating the activity (in line with the Revenue and Financing policy) and factor in rising costs.
Fees and charges do not increase in line with the Revenue and Financing policy recovery rates.
Central government funding
Budgets have been prepared including funding from the COVID-19 Response and Recovery Fund for Naenae Pool ($27M) and Tupua Horo Nuku (Eastern Bays Shared Path) ($30M).
Budgets also included funding from the Infrastructure Acceleration Fund of $99M towards growth wastewater and stormwater projects on the valley floor.
Level
of debt
The Financial Strategy sets limits on net debt at 250% of total revenue (excluding vested assets) for the period of the Long Term Plan. Net interest must be less than 15% of revenue
Level of uncertainty
Reason for the uncertainty Financial impact of the uncertainty
Low
Funding requirements are not met and therefore funding from central government does not eventuate.
Low
Funding choices for individual activities lead to lower than required increases in fees and charges.
Fees and charges recovery rates are estimated at a point in time and may differ as the year progresses and other overhead costs increase.
Receipt of this funding is dependent on continued government support for the scheme, as well as Council meeting specific milestones as the projects are completed.
Cost increases at a higher rate than the increases set for fees and charges would result in the need for funding from other sources such as rates to cover shortfalls.
Higher debt levels lead to higher servicing costs.
Moderate Council’s ability to service debt from existing funding sources reduces.
Any change in the level of grants received would require the funding gap to be made up from borrowing or for projects to reduce in scope.
Change in the capital programme, the service levels offered by Council or rates revenue requirements may lead to a change in debt levels.
110 | Page
Assumption Risk Level of uncertainty
(excluding vested assets) and less than 25% of rates revenue.
Climate change
The changing climate will affect the city and Council infrastructure due to a wide variety of climate impacts.
Climate change impacts such as sea-level rise and increased rainfall intensity will impact on the city, including Council infrastructure.
This has flowon effects, such as capital and operational cost increases to maintain functional infrastructure.
Social, economic, cultural and environmental impacts will also be felt by residents, businesses and visitors.
Water Services reform
The Water Services Reform programme was led by the previous government and there is some uncertainty due to
Reason for the uncertainty
Financial impact of the uncertainty
Moderate In the short to medium term (10–30 years), impacts are relatively certain (e.g., the sea level is rising slowly), but resulting impacts are still fairly limited. Impacts are less certain in the longer term, but likely to be more severe.
The timing of when climate change impacts will significantly impact the city and Council’s infrastructure is relatively uncertain. In addition, if global emissions are not reduced quickly, the scale of impacts is likely to increase beyond those that are already reasonably certain.
Initiatives to optimise environmental outcomes for Lower Hutt inhabitants may be too expensive to progress in a financially constrained environment; but lack of investment now is very likely to lead to worse outcomes in the future (e.g. reducing emissions quickly comes at a cost but can avoid those climate impacts that are not yet locked in).
Uncertainty of the timing and ultimate scale of impacts will affect the timing and scale of forecast capital and operational expenditure, asset impairment and reduced useful life of infrastructure assets in areas vulnerable to the harm of climate change-related events.
The legislation enacted by the new government could result in a significant change in the Low
There is a high degree of uncertainty around the nature of this change.
Any resulting change may impact revenue, expenditure assets and liabilities that Council presents, however the activity will continue, led by any new entity created.
111 | Page
Assumption Risk Level of uncertainty Reason for the uncertainty Financial impact of the uncertainty
the change in government who have repealed the legislation around reform but new legislation is not yet enacted.
It is important that planning for the council’s three waters assets is continued in the interim and included in the Long-term plan. On this basis, the Longterm Plan has been prepared with Council’s three waters services included.
We have continued to include waters in all the years of the draft Long Term Plan 2024-34 to ensure we can provide certainty to our communities around this investment and the rates impact.
service delivery model for Water services, for e.g new council controlled entity for the Wellington region.
Capital programme achievability
Our plan largely assumes that the programme can be achieved over the life of the plan with an adjustment to budgets to reflect 75% funding and delivery assumption per year.
Three Waters programme is assumed to be 100% delivered for the first three years of the
The planned capital programme is not able to be fully achieved over the life of the Long Term Plan.
The increase in demand on contractors to achieve the programme may result in
High While investments have been made in funding resources to support delivery and taking actions alongside our partners to manage the increased expenditure effectively, there are risks due to the increase in scale of the capital programme that there is not sufficient contractor availability
Delays in projects can result in additional costs, including costs of retaining project staff for longer periods and inflationary impacts.
The additional demand for contractors from the Council and in the region may impact market conditions and increase the cost of obtaining contractor services.
112 | Page
Assumption Risk Level of uncertainty Reason for the uncertainty Financial impact of the uncertainty
plan and reverts to 75% delivery per year thereafter.
Council is projecting a significant increase in its capital programme to achieve the outcomes proposed in its Long Term Plan.
cost increases.
or internal resource to support the delivery of the programme within the timeframes and projected costs included in the Long Term Plan.
113 | Page
Financial strategy
Draft Financial Strategy Long Term Plan 2024-2034
114 | Page
Contents 1. Summary and overview 2. Section A: Introduction and setting the scene 3. Section B: Our financial position leading into the preparation of the 10-year plan 4. Section C: Financial strategy guiding principles for the 10-year plan 5. Section D: Capital expenditure programme 6. Section E: Operational expenditure 7. Section F: Borrowings and investments 8. Section G: Balancing the budget 9. Section H: Rates and rates increases 10. Appendix 1: Further explanation about our approach to the balanced operating budget
Summary and overview
Council’s Financial Strategy is based on a number of important principles that provide the foundation for prudent sustainable financial management. These principles can be summarised as:
• achieving intergenerational equity by spreading costs between both present and future ratepayers
• maintaining prudent borrowing levels
• achieving a balanced operating budget and ensuring that everyday costs are paid for from everyday income
• careful consideration of the affordability of rates charges
• delivering services effectively and efficiently, and
• strengthening Council’s financial position in the long term
• maintaining principle of “growth pays for growth”
Our financial strategy focuses on strong fiscal management while addressing growing demands for increased capital investment in core infrastructure assets. Council is proposing a capital investment spend of just o$2.6 billion for the 10 years of the plan, 63 per cent of which is for three waters and 21 per cent for transport. This investment level is a significant increase of $1.2 billion compared to Long term plan 2021-31, largely due to the need to support investment in a growing city, address the infrastructure deficit with ageing assets and the impact of significant cost escalations due to a challenging economic context.
Borrowings are a key component of recognising the intergenerational equity principle, whereby the cost of long-term assets should be met by ratepayers over the life of those assets. It is important that we prudently manage the amount of borrowings, while enabling the step-up of investment in infrastructure assets. Net debt of $0.3 billion at June 2023 is projected to increase to just over $1 billion by 2030. Council has reviewed the borrowing limits and increased them to enable the funding of the larger investment programme (refer table 1). The net debt to revenue ratio is set at a limit of 250%, which is within the Local Government Funding Agency debt covenants requirements of a limit of 280%. The Council has set the limit lower at 250% as it considers it essential to maintain headroom and the ability to fund the impacts of significant natural disasters should they occur, such as extreme weather events or earthquakes
The proposed investment in three waters is lower than the levels recommended by Wellington Water Limited (WWL), which would have investment increasing by a further $1 billion. This significantly higher investment level would result in borrowing limits being exceeded if there were not offsetting mechanisms applied, such as much higher rates increases or budget cuts to other
115 | Page
services (please refer to the Consultation Document for further information). With the proposed lower level of investment included in this draft plan, the Council is effectively applying an affordability lens, which constrains the rates revenue increases and in turn limits the amount of debt we can take on. There are a range of service level impacts and risks related to the proposed investment, which are outlined in the Infrastructure Strategy.
Annual income of around $250 million is largely applied to fund operating costs for services delivered by Council and to maintain assets. A guiding principle of this financial strategy is the importance of a balanced operating budget. This means ensuring that projected operating revenue is set at a level sufficient to meet projected operating expenses, and that current ratepayers are contributing an appropriate amount towards the cost of the services they receive or are able to access; i.e., ‘everyday costs are paid for from everyday income’.
We are facing many cost pressures largely due to high inflation, interest rates, insurance, higher construction and resourcing costs. These significant economic pressures are set to continue to impact us and all councils up and down the country.
The 10-year plan projects that Council will not achieve the balanced operating budget target for a number of years, until 2029-30 (see Figure 17). This projected balanced operating budget position provides a pragmatic balance between managing the pressures on current ratepayers and ensuring the Council remains financially sustainable into the future, whereby the actions of today do not significantly impact unfairly on ratepayers in the future. This approach is financially prudent and in line with the legislative requirements, due to the longer-term plans for rates revenue generation and repayment of debt occurring to avoid a significant impact on future ratepayers. The level of funding also enables Council to maintain its levels of service and undertake asset renewals and is consistent with the Revenue and Financing Policy.
Council has considered the level of rates revenue in light of a number of factors, including affordability to ratepayers, the legislative requirement for financial prudence and the economic environment. The Council has a high dependency on rates as a principle revenue source, and there are few options available to offset cost pressures.
Over the course of developing this 10-year plan a range of savings were identified and applied to budgets totalling $34.8M over the period. These are ongoing and reduce the rates funding requirement over the 10-year period, the projected rates revenue increases for ratepayers range between 16.9 per cent and 7.2 per cent. Based on the rates revenue setting proposed, an overall increase in rates charges for 2024-25 is estimated at 16.8% for an average residential property. The rates revenue rise equates to an average increase of $10.83 per week per household or an average increase of $563 per annum. Investment in Three Waters infrastructure makes up around 45% ($251) of the average $563 per annum rise. The remaining $312 covers cost increases for all the other services provided (including roading, parks, community facilities, rubbish, recycling etc.). For an average commercial central property the increase is $63.04 per week
116 | Page
Section A: Introduction and setting the scene
What is a financialstrategy?
Our financial strategy is intended to guide the decisions we make now and, in the future, to enable Council’s contribution to the vision for Lower Hutt. The financial strategy builds on our current financial position and sets out our overall financial goals for the 10-year plan. Our strategy focuses on strong fiscal management while addressing growing demands for increased capital expenditure in core infrastructure assets such as the wastewater, water supply, stormwater and transport networks.
The Local Government Act 2002 (LGA) requires us to manage our revenues, expenses, assets, liabilities, investments and general financial dealings prudently. In doing so, we’re aware of the impact our costs and funding decisions have on our community. We’re particularly concerned about the affordability of Council services, and have carefully considered this in developing our strategy, in particular regarding the impact of rates charges.
Setting thescenefrom theAnnual Plan 2023-24
Annual Plan 2023-24 saw council dealing with unprecedented levels of cost escalations, increasing the tension on our ever-challenging balance of debt and rates funding. Council made some tough choices to slow down some capital investment, implement savings and increase the fees and charges as well as rates revenue funding to better manage these cost pressures. It was apparent through this process that the rates and debt levels would continue to have to rise significantly in the short term in order to address the infrastructure deficit and battle high-cost escalations across council services. These challenges have carried over into the 10-year plan and are summarised below:
1. Infrastructure deficit – Council owns a lot of ageing assets which require significant investment. While investing in core infrastructure is critical for supporting a city that thrives, there is a need to balance investment in key projects against financial sustainability and rates affordability.
2. Affordability constraints - Council must consider carefully what it invests in to ensure the best return on investment for the community. We don’t want to put off intergenerational and strategic investments, but we do want to ensure we aren’t unnecessarily adding to people’s financial pressures. At the same time we also need to ensure we maintain the ability to pay for our everyday costs with everyday revenue, i.e. operational expenses are paid for by operating revenue.
3. Borrowing capacity – Due to the rising costs across the board, as well as the challenges around infrastructure deficits, the Council needs to consider the strategic outcomes it wants to achieve in the longer term and the best way to mitigate risks related to achieving those outcomes through prioritisation of the investment options.
117 | Page
Strategic context and links to key aspects in the 10 year plan
Significant forecasting assumptions – refer <link>
Infrastructure Strategy – refer <link>
Revenue and Financing Policy - revenue <link>
Section B: Our financial position leading into the preparation of the 10-year plan
As at 30 June 2024, the Council’s total assets are projected to be worth over $2.3 billion and include infrastructure assets, land and buildings; whilst total liabilities are projected to be around $0.6 billion and include borrowings and payables to suppliers.
In August 2023, Standard & Poors Global Ratings Agency affirmed the Council’s AA credit rating but adjusted the outlook from stable to negative; reflecting in particular the higher borrowings.
Financial trend information of some key indicators from 2018 to 2024 are shown in figures 1 to 4; these include capital investment, net debt, revenue and expenditure. Our most recent audited Annual Report, for the period ended 30 June 2023, showed that Council achieved income of $213M and incurred operating expenditure of $241M, with a net operating deficit of $28M (per balanced operating budget definition). This result excludes the unbudgeted gain on revaluation of financial instruments of $3.6M and capital contributions of $31M.

118 | Page
Figure 1: Capital programme expenditure and delivery trend


119 | Page
Figure 2: Council net debt
Figure 3: Sources of revenue trend

Section C: Financial strategy guiding principles for the 10-year plan
Our financial strategy is based on guiding principles which provide the foundation for prudent sustainable financial management, as detailed below.
Key financial Strategy guiding principles:
1) The financial strategy enables Council’s contribution to the vision for Lower Hutt.
2) Fairness and equity
The funding of expenditure is equitable across both present and future ratepayers.
a) Intergenerational equity – the cost of long term assets should be met by ratepayers over the life of those assets. This is reflected by debt funding new assets and funding the replacement or renewal of assets from rates(depreciation funding)
b) Balanced operating budget – projected operating revenue over the lifetime of the LTPis set at a level sufficient to meet projected operating expenses (including depreciation), ensuring that current ratepayers are contributing an appropriate amount towards the cost of the services they receive or are able to access, i.e. ‘everyday costs are paid for from everyday income’.
3) Prudent sustainable financial management – budgets are managed prudently and in the best interests of the city in the long term. Debt must be maintained at prudent levels and be affordable.
4) Ability to pay (affordability) – affordability is an important consideration as it ensures that the ability of our diverse community to pay rates is transparently considered as part of the decisionmaking process. Consideration will be given at both the macro level (i.e. generally affordable to most) and also at the micro level (i.e. for a specificindividual where rates rebates, remissions or postponement policies may be required).
120 | Page
Figure
4: Operating expenditure by category trend
5) Value for money – any proposals must contribute to the strategic outcomes agreed with the community and the total cost must be reasonable. The cost effectiveness of the funding mechanism must be considered.
6) Prioritisation of investment choices – careful consideration is given to investment choices and options, with priority given to core infrastructure investment and ‘invest to save’ options.
7) Environmental sustainability - Funding decisions willconsider community outcomes being sought, including wider environmental and climate change impacts.
8) Distribution of benefits – consideration is given to the distribution of the benefits from Council activities over identifiable parts of the community, the whole community or individuals (users).
Where there are identifiable direct benefits the proportion of costsassociated with these benefits should be covered by the user(s).
9) Growth pays for growth – the capital costs incurred to develop infrastructure that supports growth within the city shouldbe primarily covered by those causing the growth and increasing the demand on Council infrastructure.
10) Good financial governance and stewardship
Good stewardship of Council’s assets and finances requires Council to ensure that its actions now do not compromise the ability of future councils to fund future community needs. Under this principle:
a) Assets must be maintained at least at current service levels to avoid placing a financial burden on future generations.
b) Debt must not be used to fund operating expenditure other than in specific exceptional circumstances.
c) The level of debt is regularly reviewed to ensure that it is at a level that will not restrict a future council’s ability to fund new assets through debt.
d) The consequential operational expenditure implications of capital expenditure decisions are considered.
Key considerations in developing the financial strategy:
A range of considerations have been applied to ensure the strategy meets the balanced operating budget and financial prudence requirements such as:
• A careful review of debt limit settings to ensure headroom is available to fund the impacts of a significant natural disaster, such as extreme weather events or earthquakes;
• The ability to fund the interest costs of debt;
• The approach to debt repayment with funding increased to support repayments;
• The approach to revenue generation being minimum increases to continue to fund services and meet cost pressures.
• The rates settings and limits imposed to meet rates affordability considerations;
• The review of projected depreciation expense and capital renewal expenditure, and the use of depreciation funding;
• A careful review of the balanced operating budget position (i.e. operating expenditure and operating revenue) and the long term broader financial impacts
121 | Page
Section D: Capital expenditure programme
Capital expenditure is categorised into renewals (renewing existing assets), service improvement (new assets that improve the services provided to the community) and growth (new assets required to accommodate growth within the city). This financial strategy focuses on strong fiscal management whilst addressing growing demands for increased capital expenditure in core infrastructure assets such as the stormwater, wastewater, water supply and transport networks.
Over the next 10 years, Council plans to spend $2.6 billion on capital investment, 63 per cent of which is in the wastewater, stormwater and water supply area, and 21 per cent on transport. This significant capital investment will be funded largely by borrowings. This is a significant increase in investment from the previous 10-year plan of $1.2 billion and reflects the need to meet community expectations for our growing city in the context of the infrastructure deficit and factor in cost escalation It should be noted that this higher investment is still lower than the recommended level by WWL for three waters. There is an option being consulted on with the recommended level of investment but would require higher rates increases to fund as we near our debt capacity constraints. There are risks associated with the lower investment as outlined in the Infrastructure Strategy. We need to remain mindful that although there is higher investment proposed under the preferred option, we still might not be able to get on top of the work required to prevent asset failure. While the focus of this plan is for 10 years, there are significant challenges beyond the period of this plan related to the deferred investment and how this will be funded.
Key investment in the plan includes:
1. three waters investment of $1.6 billion, which includes asset renewals of $939 million together with investments in reservoirs, a range of works to reduce flooding risks, works to improve environmental water quality, Infrastructure acceleration fund projects (stormwater and wastewater) and water meters etc. to name a few.
2. transport investment of $544M, including asset renewals of $149M together with investment for the Cross Valley Transport Connections project, Tupua Horo Nuku, Eastern Hutt road resilience etc.
3. investment in solid waste to the value of $58M, in city development to the value of $167M, in open spaces, and social, cultural and wellbeing to the value of $188M.
Total capital expenditure by council activity Figures 5, 6, 7 and 8 respectively show the cost of this programme by activity, spend per annum, the driver for the projects and the funding sources. This expenditure includes the cost of renewing existing assets that are coming to the end of their useful lives. It also includes the cost of improving existing assets and investing in new assets. Our asset management practices ensure we maintain service levels to at least current levels.
122 | Page
The significant increase in the capital programme, particularly in water services, also carries a level of uncertainty and risks to achievability. Wellington Water has been building capacity and capability over the last few years to improve delivery performance. Council has also been reviewing its organisational structure and making incremental changes through increased project delivery staff and the functions that support them. It is important to us that there are no delays to the programme as that may result in not meeting planned levels of service or greater costs in the long term.

123 | Page
Figure 5: Total capital expenditure by council activity
Figure 6: Planned capital investment per year over the 10 year plan


Asset management
Infrastructure deteriorates as it ages, increasing the likelihood of failures and disrupting service to customers. These failures also increase maintenance, operations and customer service costs. Planning to renew infrastructure that is reaching or at the end of its life reduces the risk ofservice interruptions and minimises maintenance costs. Tosupport our budget forecasts, Wellington Water use age-based asset information to prioritise the areas most in need of renewals. Over the next 30 years, our goal is to reduce the renewals backlog and address future needs. Council is alsoworking to better understand the condition of our assets in order to reduce the level of uncertainty and improve our overall understanding of the condition and expected life of asset.
Three waters: We received advice on our three waters assets based on the current information available to Wellington Water Limited (WWL). We are proposing to include a significantly higher capital budget for the maintenance, operations and renewal of these assets based on this advice. We have not included budgets at the levels recommended by WWL due to the constraints on debt and rates funding. This means that the available budget will be used for the most urgent jobs/projects which could mean longer times to resolve and address non-urgent jobs/projects and issues being resolved at a slower rate. The budgeted spend is however expected to result in improvements to the three waters network over the 10 years and maintain current levels of service.
Transport: The Integrated transport strategy developed in 2022 has identified some key challenges for our transport network. This 10-year plan is a step towards addressing some of these and is expected to improve the overall condition of the transport network over the 10 years. Funding constraints have also played an important role in the planned investment for this plan. Furthermore, government priorities are not yet finalised and further changes may be required in future plans to reflect these priorities.
Renewals (looking after what we have)
It is important the Council continues torenew/replace assets to ensure our assets are fit for purpose and deliver the level of service that is required. Our asset management plans identify the timing for renewals based on the condition of assets. An ongoing programme of condition assessment helps to build a detailed picture of assets and the necessary investment.
Forecast depreciation could be considered a reasonable estimate of annual renewal costs. Ifover time, renewals expenditure is approximately equal to depreciation, it can be reasonably assumed that the assets and services that they are providing are sustainable. Depreciation is however based on a
124 | Page
Figure 7: Total capital expenditure by driver Figure 8: Capital expenditure funding sources
number of assumptions and may not reflect the actual future asset renewal funding requirements (e.g., due to the long life of infrastructure assets, cost escalations, changes in scope or compliance requirements etc.).
Where there is surplus depreciation above the capital renewals level, this will enable debt to be repaid. New assets whichhave a long life will not generally require a replacement earlier in their life, so a depreciation surplus will be created which willenable debt to be repaid. The required funding will need to be borrowed when these assets come to the end of their useful life. The depreciation surplus would be dependent on the level of depreciation funding that is in place; for HCC this may be limited in the short to medium term but more certain in the longer term.
Based on current projections, while at an overall level the renewals are funded through depreciation (for the most part from year four onwards, refer figure 10) and any remaining surplus depreciation funded could be used to make debt repayments By funding renewal expenditure, together with moving to a balanced operating budget (see Section G), this enables a financially sustainable asset replacement programme.


125 | Page
Figure 9: Summary of renewal expenditure by council activity
Figure 10 - Capital Renewals compared to depreciation
Growth
The population of the city at the 2018 Census was 104,532 (Source StatsNZ).
The population is estimated to have grown by around 8,497 people, an 8 per cent increase to the 2023 figure. Further increases of around 11,817 (10% per cent) people is expected from 2023- 2033. The growth in households is projected to be about 4,217 (10 per cent) over the same period.
(Source Sense Partners)
Council’s asset management plans and infrastructure strategy have taken these growth forecasts into consideration, and our existing assets, together with the growth projects included in the plan, will ensure the city continues to meet the levels of service outlined in this plan. Total growth spend for the 10-year plan is $444M; this amount represents the growth portion of all capital projects. Council uses development contributions to allocate the costs of growth to ensure equity between developers and ratepayers. The projected revenue from development contributions is estimated at $172M over the period of the plan; this will be a funding source for the growth-related capital works programme. See the Infrastructure Strategy for further information on capital expenditure plans, together with asset information and service levels.
Section E: Operational expenditure
The Council is forecasting operational expenditure of $4.1 billion over the life of the 10-year plan, on average $408M per year over 10 years. This reflects the costs of continuing with the Council’s programme to prioritise spend based on the key priorities (see Figure 11).
We are facing many cost burdens largely due to high inflation, interest rates, insurance, higher construction and resourcing costs. These significant economic pressures are set to continue to impact us and all councils up and down the country.
The key issues we are facing are largely as a result of:
1. growth – there will be more households in Lower Hutt, based on our growth assumptions of 1.1 per cent in the first year and 0.9 per cent thereafter per annum
2. depreciation and interest payments – the increased capital expenditure programme means corresponding increases in the costs of servicing these assets
3. price increases – inflation and the factors that influence it will mean that it will cost increasingly more to do business. BERL forecasts that costs in general for the local government sector could increase by 22 per cent over the 10-year period of the plan.
126 | Page


Through the previous 10-year plan and Annual Plan 2023-24 savings were identified and applied to budgets.
Through September to October 2023, officers conducted base budget reviews which yielded $6.1M of savings over the period of the DLTP, which have been applied to budgets and had a favourable rates impact of 0.2% in 2024-25.
127 | Page
Figure 11: Operating expenditure by Council Activity (average per year over 10 years)
Figure 12: Revenue sources (average per year over 10 years)
During November 2023, officers conducted further budget reviews to identify savings and revenue opportunities of $17.4M over the period of the DLTP, which were applied to budgets (favourable rates impact of 0.9% in 2024-25).
Council has also made a range of savings and spending cut related decisions on 27 November 2023 which has led to further $11.3M reduction over the period of the DLTP (favourable rates impact of 0.4% in 2024-25).
All these savings have an ongoing effect and also reduce the rating impact, Council will continue to drive for efficiencies and revenue opportunities to reduce the rates burden into the future.
Section F: Borrowings and investments
Borrowings are a key component of recognising the intergenerational equity principle and that the cost of long term assets should be met by ratepayers over the life of those assets. It is important that the amount of borrowings is prudently managed, whilst enabling continued investment in infrastructure and community assets to continue.
With the significant capital expenditure plans we will need to increase our debt to fund what is not provided for by way of capital subsidies, development contributions income and depreciation.
The projected debt profile is outlined in figure 13 which also highlights the much higher borrowing levels compared to the Annual Plan 2023-24. The Financial Strategy for the upcoming 10 years reflects increases to other funding sources such as development and financial contributions, higher rates revenue and fees and charges to help fund the cost of infrastructure. After taking other funding sources into account, increased borrowings are funding the capital investment programme. Net debt of $0.3 Billion as at June 2023 is projected to increase to a peak of just over $1 Billion in 2029-30. As outlined in figure 12, rates revenue is our major source of funding which is constrained due to considerations around affordability and in turn constrains our debt capacity. This is because the debt we take on is directly linked to the total revenue we recover, as there are specific limits we need to stay within as outlined in table 1 below. This means the higher the rates revenue we can generate, the higher the amount of borrowings we can take on and vice versa.
The increase in Council’s debt is the result of funding major infrastructure improvement and renewals. The timing of the programme and the associated borrowing requirements has been carefully considered to ensure that this best meets the needs of the current and future generations. The proposed programme fully utilises the debt headroom capacity available whilst ensuring debt is managed prudently within the limits set.
Managing debt in a prudent manner helps the Council build resilience and sustainability, as it provides the Council with financial capacity to cope with exceptional circumstances. The Treasury Risk Management Policy outlines different measures the Council uses to limit its level of debt; Table 1 summarises these. These limits are set at prudent levels and meet the requirements of the Local Government Funding Agency. Council has reviewed the limits as part of the development of
128 | Page
this 10-year plan; the net interest to revenue and net interest to annual rates income limits have been increased to enable the funding of the increased investment programme (Figures 15 and 16).
Below 15%(10% in 2024)
Below 250%
Net debt can be increased to a maximum of 270% of total revenue at any time, provided that this is due to a significant natural disaster. Net interest
Below 25%(20% in 2024) Liquidity
Greater than 110%


129 | Page
Measure
Table 1 – Borrowing limits
Limit
Net interest to revenue
Net debt to total revenue
income
to annual rates
Figure 13: Projected net debt compared to debt to revenue limit of 250%
Figure 14: Projection of net debt to revenue ratio compared to debt to revenue limit of 250%


Managing our debt: We place reliance on a strong financial position to ensure we have capacity to borrow, both for forecast expenditure needs and any unforeseen requirements that may arise. We manage the risks proactively and ensure we have appropriate levels of debt in accordance with our debt limits, with no significant concentrations of debt repayment in any one year, ensuring working capital is maintained to meet ongoing commitments and surplus cash is invested or used to repay debt. We also focus on collection of monies owed to ensure no concentrations of credit risk exist.
Council secures borrowing by way of a debenture trust deed that provides security over rating income. Investments
Council has investments in several Council Controlled Organisations (CCOs), Civic Financial Services Ltd, the Local Government Funding Agency, property and cash.
The 10-year plan assumes that there will be no material return on investments from the CCOs, but rather that profits generated will be applied to reinvestment in the business or to repayment of
130 | Page
Figure 15: Projection of interest to revenue ratio compared to limit of 15%
Figure 16: Projection of net interest to annual rates income limit of 25%
borrowings to the Council. Cash investments: Council maintains liquidity and credit facilities to minimise financial risk and maintain secure and cost-effective funding sources to meet financial needs. In managing its liquidity, cash is invested on short-term deposit to manage cash flows and maximise returns. Surplus cash is placed on call or term deposits as appropriate. Property investments: Council has a small property portfolio with which it seeks to achieve market returns. These properties are largely held for strategic reasons, such as the RiverLink project. A property sales programme exists and will continue to deliver sales; however, Council expects these to be relatively minor for the life of the Long Term Plan. For further details on borrowings and investments are available in our Treasury Risk Management Policy
Section G: Balancing the operating budget
A guiding principle of this financial strategy is about the importance of a balanced operating budget. This means that projected operating revenue over the lifetime of the LTPis set at a level sufficient to meet projected operating expenses, ensuring that current ratepayers are contributing an appropriate amount towards the cost of the services they receive or are able to access, i.e. ‘everyday costs are paid for from everyday income’.
We need to move towards a sustainable position, balancing the budget over the medium term. The proposed capital investment programme and cost pressures in the LTP, together with limitations on revenue particularly due to affordability issues of rates, makes this very challenging. The proposed draft LTP projects a balanced operating budget position being achieved in 2028-29 (refer figure 17).
The Local Government Act 2020 (LGA) requires Council to budget each year for operating revenue at a level sufficient to meet operating expenses budgeted for that year. This is known as the “balanced operating budget” requirement. The LGA does allow councils to budget for a deficit, if it resolves that it is financially prudent to do so.
In assessing a financially prudent decision, consideration is given to:
131 | Page
Entity Shareholding/control % Principal reason for investment Budgeted return Urban Plus Limited and Group 100% Housing Nil Seaview Marina Ltd 100% Marina services $0.2M per annum Local Government Funding Agency 0.4% Borrowing Nil Civic Financial Services Ltd 4.27% Risk management Nil
Table 2: CCO investments
- the estimated expenses of achieving and maintaining the predicted levels of service provision set out in the LTP, including the estimated expenses associated with maintaining the service capacity and integrity of assets throughout their useful life
- the projected revenue available to fund the estimated expenses associated with maintaining the service - capacity and integrity of assets throughout their useful life
- the equitable allocation of responsibility of funding the provision and maintenance of assets and facilities throughout their useful life
- the funding and financial policies adopted under section 102 of the LGA.
We acknowledge that we run deficits from a balanced operating budget perspective mainly due to revenues not covering the full cost of depreciation. Council will use the following financial levers to move progressively towards achieving a balanced operating budget: fees and charges, rating for depreciation, development and financial contributions, efficiencies, debt repayment and rates setting.
The 10-year plan projects that Council will not achieve the balanced operating budget target for a number of years: until 2029-30 which effectively means we are borrowing to offset the funding shortfall. Council has considered the level of rates revenue in light of a number of factors, including the legislative requirement for financial prudence, as well as the economic environment and increasing cost pressures on households due to the high cost of living(see Section H). Setting rate levels to achieve a balanced operating budget earlier would increase the rates burden for ratepayers, and there are concerns about affordability. Adopting some smoothing of the impact over a number of years results in the best fiscal and sustainable outcome. The projected balanced operating budget position provides a pragmatic balance between managing the pressures on current ratepayers and ensuring the Council remains financially sustainable into the future, whereby the actions of today do not significantly impact unfairly on ratepayers in the future. It is financially prudent and in line with the legislative requirements due to the longer term plans for rates revenue generation and repayment of debt occurring to avoid a significant impact on future ratepayers. The level of funding also enables Council to maintain its levels of service and undertake asset renewals, and is consistent with the Revenue and Financing Policy
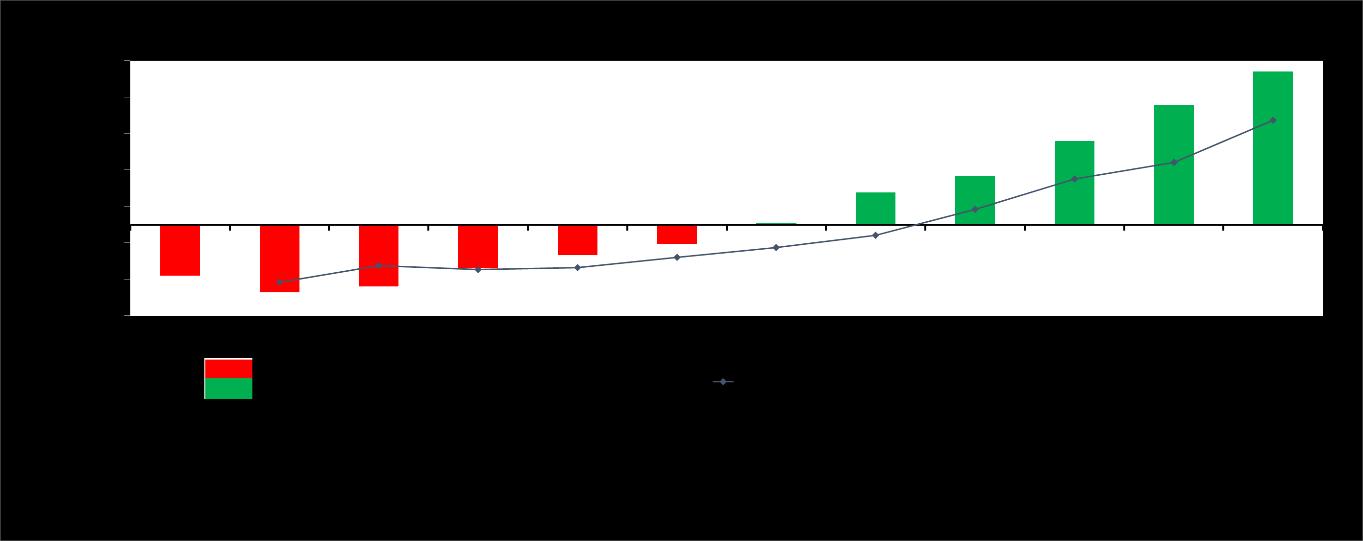
132 | Page
Figure 17: Projected HCC balanced operating budget position
Section H: Rates and rates increases
Rates revenue is the amount Council requires to provide services to residents and ratepayers after allowing for other income, such as fees and charges, grants and subsidies. The Council has a high dependency on rates revenue as its principal source of income. As Figure 12 shows, 75 per cent of operating expenditure is funded from rates over the life of the 10-year plan. Affordability of rates is a key principle of the Financial Strategy. It was front of mind as the 10-year plan was developed and rates increases considered.
The Revenue and Financing Policy has been carefully reviewed; however no material changes have been made to the policy. A rates remission for financial hardship has been proposed for the first three years of the 10-year plan to ease the burden on those households impacted by the current economic environment. Council has determined its rates increases based on a number of factors, including the levels of service it wants to provide and its capital programme. The rates revenue increases reflect the guiding principles and issues referred to earlier in this strategy, including the challenge of achieving a balanced operating budget. The economic environment with a number of legislative reforms underway, new government with potentially new priorities and high inflationary pressures introduces further uncertainty and the possibility of further financial challenges.
Due to the affordability constraints on rates revenue and limit on our ability to debt fund, there are a range of risks that the levels of service could be impacted in some areas due to cost pressures that exceed our assumptions around inflation in the future
Some level of smoothing of rate changes can provide more certainty to residents; Council considers this to be a better approach. Council has applied this approach in its projected rates increases for the 10-year plan. The Water Services Reform legislation, led by the previous government was repealed but new legislation is not yet enacted. Potentially all (or some) of the current three waters assets and related borrowings could transfer from council balance sheets to a new Water entity. Due to the change in government there is a lot of uncertainty as to what the future holds in this area; as a result, the 10-year plan assumes that Council will retain the current three waters infrastructure. The projected rates increases have been considered in light of this. This allows us to provide certainty to our community around the rating impact and the planned levels of investment. This assumption will be advised as new information becomes available.
The LGA requires the Council to quantify its limits on rates increases, see Table 3. The rates revenue increases below have been It is important to distinguish between the increases in rate revenue from year to year and the average rate increase. Our revenue does not only reflect the impact of rates increases to the average ratepayer; it also includes rate revenue received from the growth in new rateable properties each year, which are expected to be about 1.1 per cent for the first year then 0.9 per cent per annum thereafter
133 | Page
Further information about the indicative rating impact for the average ratepayer by category and suburb is available in the Rates Funding Impact Statement (refer section X).
Notes:
1) These figures include inflation but exclude GST.
2) These figures do not take into account additional income from new properties in the city each year. Property growth is assumed to be around 1.1% in the first year then 0.9% annually.
3) Targeted rates for introduction of the new Food and Green waste service will be consulted on through the Long term Plan 2024-34. This service is required to meet longer term waste minimisation goals.
134 | Page
2024/ 25 2025/ 26 2026/ 27 2027/ 28 2028/ 29 2029/ 30 2030/ 31 2031/ 32 2032/ 33 2033/ 34 Projected rates income1 ($millions ) 182.1 203.7 228 255.1 285.5 319.4 345.3 373.3 403.5 436.2 Rates revenue increase2 16.9% 12.0% 12.4% 9.5% 11.0% 11.0% 7.2% 7.2% 7.2% 7.2% Rates revenue increase for new Food and Green Waste service3 2.0% Local Governm ent Cost Index benchma rk 3.4% 2.2% 2.3% 2.3% 2.2% 2.1% 2.0% 2.0% 1.9% 1.9% Assumed growth in rating base4 1.1% 0.9% 0.9% 0.9% 0.9% 0.9% 0.9% 0.9% 0.9% 0.9%
Table 2: Summary of proposed rates increase limits and projected rates
Appendix 1: Further explanation about our approach to the balanced operating budget
The Local Government (Financial Reporting and Prudence) Regulations 2014 established eight benchmarks against which all councils must report. One of these benchmarks is the balanced operating budget, defined as ‘Council Revenue excluding development contributions, vested assets, gains on derivatives and revaluations of property, plant and equipment as a proportion of operating expenses – excluding losses on derivatives and revaluations.
This definition includes NZ Transport Agency - Waka Kotahi capital subsidies as revenue and assumes councils fully rate for depreciation. Depreciation spreads the capital cost of assets over their useful lives, so that each generation of ratepayers pays for their share of the use of the asset. Not fully funding for depreciation may place a burden on future ratepayers, who have to pay for the asset replacement. Funding depreciation supports the intergenerational equity principle, whereby everyone who benefits from use of an asset pays for their share over the asset’s useful life. By rating for depreciation, we are providing cash to fund the capital renewal programme. Depreciation is, however, based on a number of assumptions and may not reflect the actual future asset renewal funding requirements (e.g., due to the long life of infrastructure assets).
For our roading assets, it is not necessary to fully fund depreciation, as we receive a NZ Transport Agency - Waka Kotahi capital funding subsidy. We need to provide funding for ‘our share’ of the expenditure. Council has some significant projects, such as the Cross Valley Transport Connections and cycleways programmes, which we have assumed will be funded by NZ Transport Agency - Waka Kotahi in the financial projections. The NZ Transport Agency - Waka Kotahi funding and central government grant funding of the capital improvements and growth is significant, at $356M. In assessing our balanced operating budget target we have applied the Local Government (Financial Reporting and Prudence) Regulations 2014 definition, modified to exclude the NZ Transport Agency - Waka Kotahi capital improvement subsidies from the calculations of revenue. The reason for this NZ Transport Agency - Waka Kotahi adjustment is that the funding is not available to meet our day-to-day operational costs. In a similar way we have also modified the definition of revenue to exclude central government co-funding for various projects.
Understanding the operating surplus/(deficit)
Figure 18 shows a comparison of the projected operating results based on three different methods: financial accounting standards (orange), the local government balanced operating budget benchmark method (green) and the Hutt City Council balanced operating budget method as described in Figure 17 (blue).
135 | Page
The projected financial accounting results (orange) include non-cash items such as ‘income’ from vested assets and the impacts of revaluations of assets resulting in three-yearly peaks. These accounting results reflect the accounting position as meeting all the Public Benefit Entity International Public Sector Accounting Standards (PBE-IPSAS) reporting standards. The large spikes in favourable results are a result of the accounting requirement to revalue assets, which is assumed to occur every three years. Although there are projected accounting operating surpluses for most years of the plan (orange), and projected balanced operating budget benchmark surpluses (green), the Hutt City Council balanced operating budget target shows deficits until 2028/29. This is because part of the income we receive is from Waka Kotahi NZ Transport Agency in the form of a subsidy for expenditure on our roading network. The subsidy is to cover both operating and capital expenditure. We also receive capital grant funding tagged to specific capital spend.
The capital components of the above funding need to be spent on capital items and is not available to meet the day-to-day operational costs. This funding is reflected in the orange and green lines and hence the projected results are more favourable. In the Hutt City Council balanced operating budget projection, the ring-fenced funding for Waka Kotahi NZ Transport Agency funded capital improvement works has been excluded, as well as central government grant funding tagged for capital projects. Excluding this ring-fenced funding from the operating results provides more accuracy in terms of the projected underlying operating result.

136 | Page
Revenue and financing policy
Section A: Introduction
A wide number of funding sources are available to Council to fund its activities, ranging from general and targeted rates through to fees and user charges. This policy outlines Council’s approach to funding its activities. It provides information on what funding tools are used and who pays, as well as describing the process used to make these decisions. This policy should be read in conjunction with the Funding Impact Statement (see section 6). The Funding Impact Statement is the mechanism used to implement the Revenue and Financing Policy and provides detail on how rates are set.
Support for principles relating to Māori
Section 102(3A) of the Local Government Act 2002 provides that this policy must support the principles set out in the Preamble to Te Ture Whenua Māori Act 1993 (that requirement is effective from 1 July 2024). These principles include recognition that land is a taonga tuku iho of special significance to Māori people, and to facilitate the occupation, development, and utilisation of that land for the benefit of its owners, their whanau, and their hapū. Council considers that this policy supports those principles, particularly when viewed in conjunction with Council’s Policy on Remission and Postponement of Rates for Māori Freehold Land and applying those principles to the Development and Financial Contributions Policy.
Section B: Changes to the policy
A new targeted rates for Food and green organics waste has been included in Section H - funding needs analysis under the Solid waste activity.
Section F is updated to reflect proposals for minor changes to rates allocation percentages across the commercial and utility categories.
Minor editorial changes have been made to the layout and presentation of items in the policy.
137 | Page
Council determines appropriate funding sources using a two-step process on an activity-byactivity basis.
Section C: How does Council decide what is funded from where?
Step One
The funding needs of Council must be met from what Council determines to be the most appropriate funding source for each activity following consideration of:
• the community outcomes to which the activity contributes
• the distribution of benefits between the community as a whole and any identifiable parts of the community and individuals
• the period over which the benefits are expected to occur
• the extent to which the action or inaction of particular individuals or groups contributes to the need for the activity to take place
• the costs and benefits of funding an activity distinctly from other activities. Council has considered the matters above for funding operating and capital expenditure arising from Council’s activities. Section D provides an explanation of the funding tools for operating expenditure. Section E discusses the funding tools for capital expenditure funding and the principles applied in their use. The funding needs analysis in Section G provides a more detailed discussion of the use of different funding tools for operating and capital costs and the reasons for the allocation of costs to various sectors of the community for each activity.
StepTwo
The second step in the process is for Council to apply its judgement to the overall impact of any allocation of liability on the current and future social, economic, environmental and cultural wellbeing of the community. In exercising this judgement, Council considers the following:
• the impact of rates and rates increases on residential properties, and in particular on the affordability of rates and rates increases for low, average and fixed income households
• the impact of rates and rates increases on businesses and on the competitiveness of Lower Hutt as a business location
• the fairness of rates (and changes in rates) relative to the benefits received for ‘stand-out’ properties with unusually high capital values
• the special characteristics of particular classifications of property – including their purpose and proximity to the city
• the complexity of the rating system and the desirability of improving administrative simplicity
• the change in relative rateable values between types of properties.
As the General rate is a general taxing mechanism, shifting the ‘differential factor’ for each sector’s share of the city’s overall capital value is the principal means that Council has used to achieve the desired overall rates impact on the wider community. Council considered the application of this in terms of affordability for all sectors in applying the general rate differentials.
138 | Page
Section D: Funding of operating expenditure
The policy sets target funding bands for the main funding sources for each activity. The funding bands are:
• High: 80–100%
• Medium/high: 60–79%
• Medium: 40–59%
• Medium/low: 20–39%
• Low: 0–19%
Our funding sources for operating expenditure and how they are applied is as follows:
139 | Page
Funding source Priority of application to operating costs Definition Other revenue: Grants and subsidies 1 Funding received from other agencies, usually for specific projects/programme of work Other revenue: Other 2 Interest income, profit on sale of assets User fees & charges 3 Fees charged for Council services provided Targeted rates 4 Rates set for a specific activity General rates 5 Rates for activities not covered by targeted rates External borrowing 6 Borrowings to meet operational cash flow requirements where the above funding sources are inadequate to meet these needs. Generalrates
General rates provide Council’s largest source of funding. General rates are used to help fund activities where the Council has concluded that the whole community or city benefits. This is sometimes referred to as a public good that can demonstrate the following characteristics:
• non-rival – the enjoyment by one person does not prevent the benefit from being enjoyed by others. An example is street lighting
• non-excludable – no person or group can easily be prevented from enjoying the benefit. An example is a beach or park.
In these cases, all ratepayers pay towards the cost of the activity. Where the activity also provides benefits to individuals or parts of the community, rates are used to fund the balance of costs after the potential for user charges has been exhausted.
Council sets general rates based on the capital value of properties. Capital value is used because, in the main, it reflects the ability to pay better than the alternatives of land value or annual value.
What each ratepayer pays depends on the capital value of their property relative to the value of other properties, and on the share of the general rate that has been allocated to each sector of the community (residential, commercial and utilities).
Uniformannualgeneralcharge
Council also has the option to assess a uniform annual general charge (UAGC). A UAGC recovers a portion of general rates costs as a fixed amount per rating unit. Such fixed charges tend to have a disproportionate impact on low-income households, as the charges make up a higher proportion of such a household’s income. For this reason, Council does not currently utilise a UAGC.
Council does, however, use fixed amounts for some targeted rates.
Targetedrates
Council uses targeted rates where it has decided that the cost of a service or function should be met by a particular group of ratepayers (possibly even all ratepayers) or in order to provide greater transparency about the use of the funding. There is considerable scope to set rates for a specific function (e.g., water), target a rate on a specific geographic area (e.g., Jackson Street), or set different levels of rates for different property types (e.g., a promotion levy targeted on Commercial Central properties).
Thereis anew targetedrateproposedinthe10-yearplanforFoodandGreenorganicswastefrom1 July 2027 –RefertosectionHforfurtherdetails.
Fees andcharges
User charges are used where there are strong benefits to individuals or parts of the community from an activity and it is feasible to collect fees.
140 | Page
User charges contribute to the cost of some facilities (such as swimming pools) and also fully or partly meet the cost of regulatory services, such as those under the Building Act 2004 and Resource Management Act 1991.
Similarly, Council has the ability to fine people and businesses for certain rule infringements. The amount of income derived through these fines depends on the level of non-compliance and the resourcing Council is able to put into enforcement activities.
Otherfundingsources
Council’s other main funding sources for operating expenditure are grants and subsidies. Waka Kotahi New Zealand Transport Agency funding assistance for road maintenance makes up the majority of this funding. Other central government funding is occasionally available for specific projects and initiatives.
Council does not intend to use borrowing, proceeds fromasset sales, development contributions or financial contributions to help fund operating expenditure unless the sources identified above are insufficient to meet its revenue needs.
141 | Page
Section E: Funding of capital expenditure
Our funding sources for capital expenditure and how they are applied is as follows: Funding
Grants and subsidies
1 Funding received from other agencies, usually for specific projects/programme of work such as Waka Kotahi New Zealand Transport Agency (in relation to certain roading projects), Crown Infrastructure Partners (COVID-19 Response and Recovery Fund), Kainga Ora (Infrastructure Acceleration funding for valley floor wastewater and stormwater projects), and Upper Hutt City Council (in relation to joint wastewater activities).
2 Revenue under the Local Government Act 2002 to help fund planned growth-related capital expenditure for roading and transport, stormwater, wastewater and water. Financial/Environmental
3 Revenue under the Resource Management Act 1991 to help fund growth-related capital expenditure on recreation reserves, and for other infrastructure where individual developments give rise to capital expenditure that is not planned, and therefore is not included in Council’s Development and Financial Contributions Policy.
142 | Page
source Priority of application to capital costs Definition
Development contributions
contributions
Proceeds from sale of assets 4 Revenue from sale of assets not otherwise used for debt reduction Rates 5 Rates collected to cover depreciation charges Operating surplus 6 Surplus revenue available after paying for all operational costs
External borrowing
7 Borrowings to meet capital cash flow requirements where the above funding sources are inadequate to meet these needs. Repayments of debt are spread across several years. This enables Council to better match funding with the period over which benefits will be derived from assets and helps ensure intergenerational equity.
Borrowing and repayments are managed within the framework specified in the Liability management section of the Treasury Risk Management Policy.
143 | Page
Funding source Priority of application to capital costs Definition
Section F: General rate differential factor
The general rate payable on each category of property is expressed as a rate in the dollar of capital value. These different rates in the dollar for different property categories are known as ‘differential factors’ and are determined following the completion of step two of the process (which is designed to allow the Council to apply its judgement on the overall impact on the wellbeing of the community). This judgement includes the consideration of the matters in step two above, including activity areas where the benefits of the activity are not considered to be equally shared among the community.
Following a review Council undertook for the purposes of the previous 10-year plan, the general rate will continue to be apportioned between residential, commercial and utility categories based on a percentage applied to each category group. A percentage approach helps to reduce fluctuation in the general rate caused by valuation movement differences between categories.
For the 10-year plan Council considered the matters in step two above and options for modifying the differentials as overall impact adjustments. It considered the competing interests of different sectors of ratepayers as set out in the step two process (see Section C), particularly the different abilities of the residential and commercial sectors to accommodate rate increases at this time, and the impacts of those increases, particularly on rates affordability. Other considerations of Council included:
• the impacts of the changes made in the previous 10-year plan
• the outcome of the latest three-yearly property revaluation completed in 2022
• recent development plans in the city through number and value of consents
• other economic factors for both commercial and residential ratepayers.
In its judgement, Council has decided that the overall percentage allocation for the residential and commercial (including utility) categories should remain the same as 2023-24 with minor adjustments to the individual commercial category percentages, and differential adjustments should be made to give effect to this.
The indicative percentages to be applied forthetermofthe10-yearplanunder the policy are as follows (including 2023-24 as a comparator):
144 | Page
Differential category 2023-24 2024-25 2025-26 2026-27 Residential 60% 60% 60% 60% Commercial central 8.0% 7.7% 7.7% 7.7%
The general rate for Rural rating units is differentiated on the basis of perceived distance to Council services. Rating units to which this differential will apply are those within Rural activity areas in the Council’s operative District Plan.
For the smaller rural and community facilities differential rating categories a standard differential multiplier will be applied. This reflects the fact that small changes in the category may significantly impact average rates on individual properties if a percentage was applied.
The differential factors for these categories are: •
The following indicativedifferential factors will be applied across all differential categories in 2024/25 to give effect to category percentages.
•
•
3.406
This policy should be read in conjunction with the Funding Impact Statement which provides further details on how rates are set.
145 | Page Differential category 2023-24 2024-25 2025-26 2026-27 Commercial suburban 25.3% 25.4% 25.4% 25.4% Utility 5.4% 5.6% 5.6% 5.6%
Rural 0.747 • Community Facilities1 1.000 • Community Facilities2 0.500
Community Facilities3 2.344
•
• Residential 1.00 • Commercial Central 3.465 • Commercial Suburban 2.829 • Community Facilities 1 1.000 • Community Facilities 2 0.500 • Community Facilities 3 2.344
Rural 0.747
Utility

146 | Page
Graph 1: Historicallocation of Generalrates charges between property rating categories and the proposed continued approach for the 10-year plan
Section G: Summary of operational funding sources
147 | Page
Key Rangename Unlikely Low Medium / Low Medium Medium / High High Range 0 0-19% 20-39% 40-59% 60-79% 80-100% Key ✓ ✓ ✓ ✓ ✓ Activity Feesand charges Grants, subsidesand other Gene ral rates Targeted rates Development contribution Financial contribution Borrowing Transport ✓ ✓ ✓ Water supply ✓ ✓ ✓ ✓ Wastewater ✓ ✓ ✓ ✓
Stormwater
Solidwaste
City development
Communitypartnering andsupport
Openspaces,parksand reserves (including cemeteries)
Libraries
Museums
148 | Page
✓ ✓ ✓
✓ ✓ ✓ ✓
✓ ✓
✓ ✓ ✓
✓ ✓ ✓
✓ ✓ ✓
✓ ✓ ✓
Aquatics andrecreation
Animalcontrol
Buildingconsentsand resource consents
Public Health
Emergency management
Sustainabilityand resilience
City governance
149 | Page
✓ ✓
✓ ✓ ✓
✓ ✓ ✓
✓ ✓
✓ ✓
✓ ✓
✓ ✓
Section H: Funding needs analysis
ACTIVITY BACKGROUND
Transport
The transport activity consists of five sub-activities – road assets, traffic assets, road safety services, active modes and parking. Council operates, maintains and renews the road asset, which includes footpaths, throughout the city. Traffic control measures are used to ensure the efficient and safe movement of motor vehicles, cyclists, pedestrians and other forms of transport. Road safety programmes and interventions aremanagedtoimprove thesafetyoutcomes of all users on our transport network. Walking, cycling and micromobility initiatives are managed to enable safe and efficient mode choice across our transport system. Parking involves the provision, maintenance and regulation of on- street and off-street carparks in the commercial areas of the city. The location and regulation of carparks is designed to ensurefair,easyandefficientaccess tothecity’s commercial areas.
RATIONALE
Council has no direct means tochargeindividual users of the local network onauser-pays basis. Thereforemost of the expenditure is fundeddirectlyfromgeneral rates revenue (and governmentsubsidies). Tripgenerationis auseful base indicator benefitbetween ratepayer categories. Trip generation of the Commercial/Utility and Residential sectors is estimated at 72 per cent and 28 per cent respectively. The net cost tocouncilof major projects with benefits over several decades, will be debt funded, along with an appropriate contribution from development contributions charges for growth-related infrastructure. Revenue generated from controlled parking is used to offset the costs ofproviding the activity.
Operational costs
• general rates: Medium/ high
• grants, subsidies, andother: Low
• fees and charges: Low
150 | Page
FUNDING SOURCESAND BANDS
ACTIVITY BACKGROUND
Communityoutcome
Who benefits
Economicwellbeing
Roading assets: Many of the benefits of roading networks accrue to individuals or businesses. Toa large extent, this is reflected in the subsidies Council receives from government for roading, which are ultimately funded from fuel excise, road user charges and vehicle registration charges. However, Council mustcover the remainder of the unfunded component. Trip generation can be used as an indicator of both the cause and benefit ofthis activity’s costs. Traffic assets: Traffic assets provide a range of benefits widely dispersed among the community, and for which there is little ability to charge, or sense in charging, individuals for the benefits they receive. Road safety services: Road safety services provide a range of benefits for all mode users across the network, for which there is little ability to charge, or sense in charging, individuals for the benefits they receive. Active modes: Active mode initiatives encourage behaviours that benefit health, wellbeing and the environment and there is no appetite to charge individuals for the benefits they receive. Parking: The benefits of on-street parking largely accrue to the individuals or groups involved. Controlled parking is provided in key business and shopping areas for the benefit of business. However,
151 | Page
SOURCES
RATIONALE FUNDING
AND BANDS
charging and actively monitoring parkinginmost areas, suchas most urbanneighbourhoods, is simply notpractical or costeffective –althoughsometimerestrictions may still apply. Consequently, a large proportion of the cost is simply absorbed into the roading budget, and funded accordingly. The primary beneficiaries of growth-related infrastructure are the developments that can be undertaken and the businesses and residents that occupy new sites. If, and to the extent that, investment in infrastructure benefits growth and existing residents, this is reflected in the allocation of costs between growth and levels of service or renewal.
Periodof benefit
Thebenefits of transport facilities areongoing andspreadover thelong-term. Theseintergenerational benefits support the ongoing use of debt financing for associated capital works.
152 | Page
SOURCESAND BANDS
ACTIVITY BACKGROUND RATIONALE FUNDING
ACTIVITY BACKGROUND
Whoseacts createa need
Separatefunding
Watersupply
Heavy vehicles create an additional cost to Councilbecause of the increased wear they impose on roads, and the need to have wider roads to accommodate them. Theneedtoundertake street cleaningis partially causedby theactions of individuals littering or dumping. In areas with a high concentration of parking demand, it becomes necessary and cost-effective to manage parking, allowingmuch of thecostassociatedwiththeseparks tobe recoupedthroughparkingcharges and/or fines.
Council considers that thereis littlebenefitofseparatefundingof this activity.
This activity involves the supply of high-quality drinkable water for domestic and commercial use. Council purchases bulk water from Greater Wellington Regional Council, and this accountsfor a significant portion of the total cost ofwater supply to the city. Water is then distributed around the city through the local pipe network. Council’s ownership of the pipe network is historical.
In the absence of metering, targeted rates can be seen as a proxy for user charges. All connections are charged the targeted rate, and this is assumed to cover the supply of the average residential user. Commercial water users are charged on a metered rate for water consumption. Major projects with benefits over several decades will be debt funded, along with an appropriate contribution from development contributions charges for growth-related infrastructure.
Operational costs
• targeted rates: High
• general rates: Low
• grants, subsidies and other:
153 | Page
SOURCES
RATIONALE FUNDING
AND BANDS
Low
• fees and charges: Low
Community outcome
Environmental wellbeing
Who benefits
Period of benefit
Whose acts create a need
Much of the benefit from this activity is considered to be private to the people who obtain and use the water. Public health benefits arise out of the treatment of water-borne diseases. The primary beneficiaries of growth-related infrastructure are the developments that can be undertaken and the businesses and residents that occupy new sites. If, and to the extent that, investment in infrastructure benefits growth and existing residents, this is reflected in the allocation of costs between growth and levels of service or renewal.
The benefit of most operating costs is expected to arise in the year the funding is sourced. Capital expenditure provides benefit over the life of the asset.
Properties and users who either waste or use excessive amounts of water
154 | Page
BANDS
ACTIVITY BACKGROUND RATIONALE FUNDING SOURCESAND
ACTIVITY BACKGROUND
Separate funding
Wastewater
Council ensures the treatment and disposal of household and commercial effluent according to regional and national environmental standards. A new treatment plant was commissioned in2002 toensure effluent is treated to higher standards.
Council considered that due to the administrative costs there is no further benefit in separate funding of this activity.
In the absence of the ability to use metering, targeted rates (including pan charges) can be seen as a proxy for user charges.
High water and waste users are charged fees under a trade waste by-law. Major projects with benefits over several decades will be debt funded, along with an appropriate contribution from development contributions charges for growth-related infrastructure.
Operational costs
• targeted rates: High
• general rates: Low
• grants, subsidies and other: Low
• fees and charges: Low
155 | Page
RATIONALE FUNDING SOURCESAND BANDS
ACTIVITY BACKGROUND
RATIONALE
Communityoutcome
Environmental wellbeing
Who benefits
Periodof benefit
The removal of wastewater largely benefits the person whose wastewater is removed. However, the public also benefits through improved public healthand anunpolluted environment. Theoperationof manysocial andcommercial activities wouldbecurtailedif raw effluent was not properly dealt with. Upper Hutt City Council makes an operating contribution towards the shared service. The primary beneficiaries of growth-related infrastructure are the developments that can be undertaken and the businesses and residents that occupy new sites. If, and to the extent that, investment in infrastructure benefits growth and existing residents, this is reflected in the allocation of costs between growth and levels of service or renewal.
Thebenefits of wastewaterservices areongoingandspreadoverthelong-term. Theseintergenerational benefits support the ongoing use of debt financing for associated capital works.
FUNDINGSOURCESAND BANDS
156 | Page
ACTIVITY BACKGROUND
Whoseacts createa need
Stormwater
Separate funding
Thereis alsoa significantexacerbator component tothe treatment of wastewater, as peoplecausecosts throughtheir action(for example, commercial businesses that produce trade waste) or inaction (for example, not installing a dual flush toilet).
Council considered that due to the administrative costs that there is no further benefit in separate funding of this activity.
Council operates an effective drainage system to protect property from flooding damage. Stormwater infrastructure includes pipe networks, street-side gutters, retention dams and open watercourses. These are provided and maintained according to the reasonable costs of managing foreseeable flooding events.
Community outcomes
As the community as a whole benefits from this activity, the costs are best recovered from General rates. Major projects with benefits over several decades will be debt funded, along with an appropriate contribution from development contributions charges for growth-related infrastructure.
Operational costs
• general rates: High
• grants, subsidies and other: Low
• fees and charges: Low
Environmental wellbeing
157 | Page
RATIONALE FUNDINGSOURCESAND BANDS
Who benefits
Period of benefit
Stormwater reticulation, watercourses, major storm events and watercourse quality management, addressed under this activity, are partly for private benefit but mainly for public benefit. This is interms of dealing with public spaces and the public stormwater system, maximising damage from severe flooding and conducting monitoring and pollution control for the community at large. Economies of scale associated with the provision of the overall system are also recognised. The primary beneficiaries of growth-related infrastructure are the developments that can be undertaken and the businesses and residents that occupy new sites. If, and to the extent that, investment in infrastructure benefits growth and existing residents, this is reflected in the allocation of costsbetween growth and levels of service or renewal.
The benefit of most operating costs is expected to arise in the year the funding is sourced. Capital expenditure provides benefit over the life of the asset
Whose acts create a need
Buildings and pavements increase the necessity for stormwater management, and in this respect the built-up areas can be considered to exacerbate the problem.
Separate funding
Council considered that due to the administrative costs there is no further benefit in separate funding of this activity.
158 | Page
SOURCESAND BANDS
ACTIVITY BACKGROUND RATIONALE FUNDING
ACTIVITY BACKGROUND
Solidwaste
Council contracts out the collection of residential solid waste and household recycling. It also owns a landfillfor the disposal of the city’s refuse. Councilwishes to promote recycling and waste reduction and to provide for the disposal of the city’s solid waste.
Council is proposing to expand its current rubbish, recycling and green waste collection services to provide weekly Food and Green Waste collection from 1 July2027.
Communityoutcome
RATIONALE
Currently the solid waste function makes an overall surplus, particularly as a result of landfill activities. This return on investment compensates Council as a wholeandthewholeratepayer basefor thelong-term business risks of landfill operationand aftercare. Any surplus is therefore used to offset general rates.
FUNDINGSOURCESAND BANDS
Operationalcosts
• targeted rates: Medium
• general rates: Low
• grants,subsidies and other: Low
• fees andcharges: Medium
Environmental wellbeing
159 | Page
ACTIVITY BACKGROUND
Who benefits
Period of benefit
Whose acts create a need
Council currently provides kerbside refuse, recycling, and opt-in Green waste, which are funded through targeted rates. The implementation of the Council’s new Food and Green waste collection service from 1 July2027 will help reduce greenhouse gas emissions, reduce waste to the landfill thereby prolonging the longevity of this facility, i.e. costsavings on future expansion of the site, reduce leachate and pollution and allow for organic waste resource recovery. There are public benefits in ensuring that refuse is disposed ofappropriately. The consequences of poorly dealt with waste are immediate public health effects. Longer-term health effects can also result from interaction with contaminated sites. There are private benefits to people whoserefuseis disposedof.
The benefit of most operating costs is expected to arise in the year the funding is sourced. The benefits ofcapital spend on the Landfill are ongoing and spread over a long period. These intergenerational benefits support the ongoing use of debt financing for associated capital works.
Individuals generate waste therefore creating the need for this activity. There are also individuals who create waste but do not use this service (such as illegal dumping of rubbish) and can create additional costs for Council.
Separate funding Council considered that due to the administrative costs there is no further benefit in separate funding of this activity.
160 | Page
RATIONALE FUNDINGSOURCESAND BANDS
ACTIVITY BACKGROUND
Citydevelopment
Council has a leading role in fostering the city’s growth and development in a number of ways. Council develops the District Plan policy and makes changes to the District Plan in line with national and regional policy changes and also in line with expectations of the local community. Council aims to develop an urban environment that will help to attract people and investment, and enhance the city’s image and economy. Council manages and develops the public space of the city on behalf of the community. Council
RATIONALE FUNDINGSOURCESAND BANDS
Whilebusinesses andresidents benefitfromcitydevelopment,after maximising other available funding(whichare mostly non-existent), it is considered appropriate that the remainder of the activity is funded from General rates. The net cost to council ofmajor projects with benefits over several decades, will be debt funded, along with an appropriate contribution from development contributions charges for growth-related infrastructure.
Operationalcosts
• general rates: High
• grants,subsidies and other: Low
161 | Page
aims to create a businessfriendly environment, facilitate the expansion and creation of local businesses and employment, increase tourism to the city and contribute to regional growth through regional economic development initiatives.
Communityoutcome
Who benefits
This activitycontributes toall community outcomes.
District/spatial planning and urban design has a mix of private and public benefits, as well as encouraging optimal resource use over time. The Council develops these with input from the community in termsof the Resource Management Act. Certain parts of the community, such as business owners, may gain distinct private benefits as a result of Councilwork inshopping areas etc. Benefits are ongoing, and work particularly around the preservation of heritage elements is intended for the benefit of future generations. The benefits of preservingbuildings of architectural, heritage andhistoric valuepertainto boththecommunity as awhole andtheowner or occupier. The city’s businesses and residents benefit from Council’s supportof the business sector and from its promotion of the city as a place to visit.
162 | Page
ACTIVITY BACKGROUND RATIONALE FUNDINGSOURCESAND BANDS
ACTIVITY BACKGROUND
RATIONALE FUNDINGSOURCESAND BANDS
Periodof benefit
Whoseacts createa need
Thebenefit of most operating costs is expectedtoariseinthe year thefundingis sourced. Thebenefits of urbandevelopmentareongoing andspreadover the long-term. Theseintergenerational benefits support the ongoing use of debt financing for associated capital works.
Thereis very limitedimpact of theactions or inactions ofothers.
Separatefunding Council consideredthat duetothefinancial scaleof the activity thereis no further benefit inseparatefundingof this activity.
Communitypartneringandsupport
Council provides a range of community hubs and facilities to enable the delivery of community activities and provide safe inclusive spaces for the community. Council has previously carried out a significant rejuvenation programme across its community facilities to improve the wellbeing of Hutt City residents.
As thecommunity as awholebenefits from this activity, the costs arebest recoveredfrom General rates.The net cost tocouncil ofmajor projects with benefits over several decades, will be debt funded, along with an appropriate contribution from development contributions charges for growth-related infrastructure.
Operationalcosts
• general rates: High
• grants,subsidies and other: Low
• fees andcharges: Low
163 | Page
Community outcome
Social and cultural wellbeing
Who benefits
No particular sector or group is considered to drive or benefit from these costs beyond those groups that can be targeted by user fees.
Period of benefit
The benefit of most operating costs is expected to arise in the year the funding is sourced. The benefits ofcommunal facilities (e.g.,halls, hubs etc.) are ongoing and spread over the long-term.
Whose acts create a need
None identified
Separate funding Council considered that due to the financial scale of theactivity there is no further benefit in separate funding of this activity.
164 | Page
FUNDINGSOURCES
ACTIVITY BACKGROUND RATIONALE
AND BANDS
Openspaces,parksandreserves(includingcemeteries
Council provides and maintains passive recreational facilities in the city for the enjoyment and wellbeing of the public, free of charge. Sports fields are provided and maintained through charges to sports codes. Recreation areas are both natural and created; the majority of Council effort is targeted at maintenance and retaining areas in their natural state.
Noparticular sector or groupis consideredto derivebenefit from these costs beyondthosegroups that canbetargeted by user fees.
Majorprojects withbenefits overseveral decades will be debtfunded,alongwith anappropriatecontributionfromreservefinancial contributions charges for growth-related infrastructure.
Operationalcosts
• general rates: High
• grants,subsidies and other: Low
• fees andcharges: Low
Communityoutcome
Social andcultural wellbeing
165 | Page
ACTIVITY BACKGROUND RATIONALE FUNDINGSOURCESAND BANDS
Who benefits Parks and reserves: Council views the active participation of residents in outdoor activities as beneficial to the whole community. While it is recognised that the rural sector often provides its own recreational land, Council considers that this sector is also a beneficiary from this activity. Cemeteries: There is a significant private benefit in this service to the families ofdeceased people where burials and interment services are provided. There is also anongoing community benefit in providing for the respectful treatment of deceased people who form part of the community’s heritage and whakapapa. The primary beneficiaries of growth- relatedopenspaces, park andreserves are thedevelopments that canbe undertakenandthe businesses andresidents that occupy new sites. Tothe extent that investment in this infrastructure benefits growth and existing residents, this is reflected in the allocation of costs between growth and levels of service or renewal.
166 | Page
ACTIVITY BACKGROUND RATIONALE FUNDINGSOURCESAND BANDS
Periodof benefit
Whoseacts createa need
Thebenefit of mostoperating costs is expectedtoariseintheyear thefundingis sourced. Capital expenditureprovides benefit over the life of the asset.
Theactions of sportscodes contributetothe needfor Council toundertake the maintenanceof sports fields. Housingintensification andurbandevelopmentto respondtopopulationgrowthcreates aneedforgreenspaces.
Separatefunding Council consideredthat duetothe administrativecosts thereis nofurther benefit inseparatefundingof this activity.
167 | Page
ACTIVITY BACKGROUND RATIONALE FUNDINGSOURCESAND BANDS
creativity,learning,andrecreation
Connectivity,
ACTIVITY BACKGROUND
Libraries Council provides, maintains and manages eight libraries in the city. These are run as a single city-wide service. Their primary roleis to providewrittenand recordedmaterial such as books, audio-visual resources, and access to online information. Library services are used for many purposes including learning, research and entertainment.
Communityoutcome
Who benefits
RATIONALE FUNDINGSOURCESAND BANDS
Some of the individual benefit of library activities is recovered through user charges and fines. User recovery is also constrained by section142 of theLocal Government Act 2002.General rates aretheappropriatefunding sourcefor the remainder of theactivity, as the whole of thecommunity benefits from libraries.
The net cost to council ofmajor projects with benefits over several decades, will be debt funded, along with an appropriate contribution from development contributions charges for growth-related infrastructure.
Operationalcosts
• general rates: High
• grants,subsidies and other: Low
• fees andcharges: Low
Social andcultural wellbeing
Whilethere are identifiableindividual benefits from theprovisionof library services, theCouncil views openandlow-cost access toinformation and books as being in the best interest of the city as a whole, therefore the whole city benefits.
168 | Page
ACTIVITY BACKGROUND
RATIONALE FUNDINGSOURCESAND BANDS
Museums
Periodof benefit
Thebenefit of mostoperating costs is expectedtoariseintheyear thefundingis sourced. Capital expenditureprovides benefit over the life of the asset.
Whoseacts createa need Thereis very limitedimpact of theactions or inactions ofothers.
Separatefunding Council consideredthat duetothe administrativecosts thereis nofurther benefit inseparatefundingof this activity
The Council believes that support for the arts, recognition of our social history and cultural endeavours are an important componentin makingthecityavibrantand attractivecity,as well as providing a means for the community to express a sense of self and place.
Communityoutcome
Who benefits
Someof theindividual benefit of museum activities is recoveredthroughuser charges. General rates aretheappropriatefunding source for the remainder of the activity, as the whole community benefits from museums.
The net cost to council ofmajor projects with benefits over several decades, will be debt funded, along with an appropriate contribution from development contributions charges for growth-related infrastructure.
Operationalcosts
• general rates: High
• grants,subsidies and other: Low
• fees andcharges: Low
Social andcultural wellbeing
Whileindividual visitors tothesefacilities do gainindividual benefit, the collectingof anentry feewouldbeinefficient duetothe costs associated with establishing and operating a door charge system. Council recognises the contribution that the Dowse Foundation and donors are making to the city through extensive community fundraising activities.
169 | Page
ACTIVITY BACKGROUND
RATIONALE FUNDINGSOURCESAND BANDS
Periodof benefit
Thebenefit of mostoperating costs is expectedtoariseintheyear thefundingis sourced. Capital expenditureprovides benefit over the life of the asset.
Whoseacts createa need Thereis very limitedimpact of theactions or inactions ofothers.
Separatefunding Council consideredthat duetothe administrativecosts thereis nofurther benefit inseparatefundingof this activity.
Aquatics and recreation Council provides and maintains sixswimming pools inthe city as part of its portfolio of recreational facilities.
Recreational programmes are community-based programmes designedto encourageresidents to engageina range of recreational activities. These services are provided to promote health and enjoyment and stimulate the community’s interest in different recreational opportunities.
Fees andcharges contribute totherecovery of individual benefit. However, the fees areset at alevel that supports affordability for users to access facilities. Therefore General rates are the key source of income for this activity.
The net cost to council ofmajor projects with benefits over several decades, will be debt funded, along with an appropriate contribution from development contributions charges for growth-related infrastructure.
Operationalcosts
• general rates: Medium
• fees andcharges: Medium
170 | Page
ACTIVITY BACKGROUND
Communityoutcome
Who benefits
RATIONALE FUNDINGSOURCESAND BANDS
Environmental wellbeing
Individuals benefit from thepersonal fitness andenjoyment they derivefrom usingthefacilities. However, Council alsorecognises that there are positive benefits for the community when the population is fit and actively engaged. Pools provide quality and accessible tuition in essential water safety and life skills,whichproduces both individual and community benefits.
Regulatoryservices
Animalcontrol
Periodof benefit
Whoseacts createa need
Thebenefit of mostoperating costs is expectedtoariseintheyear thefundingis sourced. Capital expenditureprovides benefit over the life of the asset.
Thereis very limitedimpact of theactions or inactions ofothers.
Separatefunding Council consideredthat duetotheadministrativecosts that thereis nofurther benefit inseparatefundingof this activity.
Animalcontrol is primarilythedog controlfunctionwitha small amount of service involved with general livestock control. Dog registration fees are a targeted form of costrecovery for this activity. An animal control function is necessary to ensure the public is safe from the negative effects of
As bothindividuals andthecommunity benefit from this activity, it is appropriatethat themix of funding is split betweenfees and charges, other revenue and general rates.
Operationalcosts
• general rates: Medium/ Low
• grants, subsidies and other: Medium / Low
• fees and charges: Medium
171 | Page
ACTIVITY
animal ownership.
Building consentsand resource consents
Communityoutcome
Who benefits
Environmental wellbeing
Theowners of dogs benefit from theavailability of theservice, whilethewhole community benefits from havingasafer environment because of dog control.
Periodof benefit
Whoseacts createa need
Separatefunding
The activity includes regulatory consents and compliance functions for building work inLower Hutt, general advice to the public on consenting matters, co-ordination of Land Information Memorandum applications and advice on environmentally sustainable residential design and products.
Thebenefit of most operating costs is expectedtoariseinthe year thefundingis sourced. Thereis noplannedcapital expenditure.
Theactivity canbeconsideredan exacerbator issue, as the actions of animal owners createtheneedfor theservice, includingthose people who are not good dog owners.
Council consideredthat duetothe administrativecosts that thereis nofurther benefit inseparatefundingof this activity.
The activity predominantly benefits those individuals who obtain a building or resource consent. However, these activities protect the public interests of all residents and businesses by ensuring the city grows in ways that encourages high-quality development and produces the best long-term results, so it is considered appropriate that a portion of the costs are funded via general rates.
Operational costs
• general rates: Medium/Low
• grants, subsidies and other: Low
• fees and charges: Medium/High
172 | Page
BACKGROUND RATIONALE FUNDINGSOURCESAND BANDS
ACTIVITY BACKGROUND
Community outcome
Who benefits
Environmental wellbeing
There is a direct benefit to those property owners who are obtaining a building consent, while there is a benefit to the community of ensuring safe and sanitary buildings. Generally, commercial buildings are more complex and therefore there is a greater benefit to the commercial sector than the residential sector.
PublicHealth
Period of benefit
Whose acts create a need
Separate funding
The activity provides inspection, auditing, enforcement and education that ensures compliance with Council’s policies and regulations concerning public health.
Community outcome
Who benefits
Period of benefit
The benefit of most operating costs is expected to arise in the year the funding is sourced. There is noplanned capital expenditure.
Non-complying buildings and businesses operating without consent.
Council considered that due to the administrative costs that there is no further benefit in separate funding of this activity.
The activity predominantly benefits those individuals who obtain the appropriate license. However, this activity protects the whole community.
Operational costs
• general rates: Medium
• fees and charges: Medium
Environmental wellbeing
The public receive a benefit from this activity due to the compliance of the businesses with the public health standards. Businesses also receive a benefit due to customers’ assurance that individual businesses are meeting the appropriate standards.
The benefit of most operating costs is expected to arise in the year the funding is sourced. There is noplanned capital expenditure.
173 | Page
RATIONALE FUNDINGSOURCESAND BANDS
ACTIVITY BACKGROUND
Whose acts create a need Businesses not complying with publichealth requirements.
Separate funding Council considered that due to the financial scale of theactivity there is no further benefit in separate funding of this activity.
Sustainabilityandresilience
Emergency management Council develops and implements city-wide emergency managementplans andpromotescommunity preparedness for emergencies
Communityoutcomes
Who benefits
Periodof benefit
As thecommunity as awhole benefits fromthis activity, the costs arebest recoveredfrom General rates.
Environmental wellbeing
Thewholecommunity benefits from this activity. Itis triggeredwherethe disruptiontocommunity lifeis suchthat acoordinated community response is required.
Thebenefit of most operating costs is expectedtoariseinthe year thefundingis sourced. Thereis noplannedcapital expenditure.
Whoseacts createa need Noneidentified
Separatefunding Council consideredthat duetothefinancial scaleof the activity that thereis no further benefitinseparatefundingthis activity.
Operationalcosts
• general rates: High
• grants,subsidies and other: Low
174 | Page
RATIONALE FUNDINGSOURCESAND BANDS
ACTIVITY BACKGROUND
RATIONALE FUNDINGSOURCESAND BANDS
Sustainabilit
yand resilience Council enables system change by enabling the delivery of its Energy and Carbon Reduction Plan 2020–24, improving sustainability outcomes across Council and the community, and funding initiatives or kickstarting thinking inlinewithits EnvironmentalSustainability Strategy2015–45.Thisactivity also comprises work to engage with the community on climate change; in particular, the development of a pathway to reduce city-wide emissions to net zero by 2050, and a pathway for how as a community we should respond to forecast climate impacts, such as sea-level rise.
As thecommunity as awhole benefits from this activity, the majority of the costs arebest recoveredfrom General rates.
Operationalcosts
• general rates: High
• grants,subsidies and other: Low
Communityoutcome Environmental wellbeing
175 | Page
ACTIVITY BACKGROUND
Who benefits
Periodof benefit
Thewholecommunity benefits from this activity. Itis triggeredwherethe disruptiontocommunity lifeis suchthat acoordinated community response is required.
Thebenefit of most operating costs is expectedtoariseinthe year thefundingis sourced. Thereis noplannedcapital expenditure.
Whoseacts createa need Noneidentified
Separatefunding Council consideredthat duetothefinancial scale of theactivitythereis no further benefitinseparatefundingof this activity.
Governance,strategyandpartnerships
Council, as the elected governance body, is responsible for deciding the direction and objectives of the activities it delivers on behalf of the city. Council is required by law to have elected members. Community representatives on CommunityBoards arealso elected; theyarepartof Council and provide local input into governance issues.
As thecommunity as awholebenefits from this activity, the costs arebest recoveredfrom General rates.
Operationalcosts
• general rates: High
• grants,subsidies and other: Low
176 | Page
RATIONALE FUNDINGSOURCESAND BANDS
ACTIVITY BACKGROUND
Community outcome This activity contributes to all community outcomes
Who benefits
Period of benefit
Whose acts create a need
The beneficiaries of this activity are the people and organisations in the citywho benefit through the democratic governance of the city’s affairs.
The benefit of most operating costs is expected to arise in the year the funding is sourced. There is no planned capital expenditure.
None identified
Separate funding Council considered that due to the financial scale of theactivity there is no further benefit in separate funding of this activity.
177 | Page
RATIONALE FUNDINGSOURCESAND BANDS
Infrastructure strategy
Te Awa Kairangiki Tai Lower Hutt2024 – 2034 Infrastructure Strategy
CONTENTS:
1. Mayor’s foreword
2. The Strategy at a glance
3. Infrastructure supports Te Awa Kairangi ki Tai Lower Hutt to be a liveable city
4. Why infrastructure matters
5. Outcomes & scope
6. Lower Hutt’s infrastructure networks in more detail
7. The changing face of Te Awa Kairangi ki Tai Lower Hutt
8. Changes in the national and regional context
9. Key infrastructure challenges and risks
10. How Council aims to meet its infrastructure challenges
11. Implementing the Strategy: the key core infrastructure projects
12. Assumptions informing the Strategy
13. Financial projections
14. Appendices
178 | Page
MAYOR’SFOREWORD
Infrastructure underpins the quality of life we value. Our homes are connected to and protected by our water networks, and we make the most of the great recreation spaces in our city by using a connected network of roads, cycleways and footpaths. Infrastructure supports Te Awa Kairangi ki Tai Lower Hutt to be a liveable city and plays a vital role in protecting our health, property, and the environment.
Our city is growing, housing is intensifying, and we are experiencing more extreme weather events because of changes in the climate. This is challenging our infrastructure with a growing demand for water and increasing pressure on an ageing waste and storm water network.
Infrastructure is intergenerational. Built well, infrastructure assets can last for over a century. Investment in infrastructure requires substantial capital investment when it needs replacing or requires significant maintenance. Council has tripled its investment in renewing water pipes in the network, but there is much more to do.
Council funds infrastructure through a mix of revenue from rates and Council borrowing. Given the significant costs associated with building and maintaining infrastructure this Strategy sets out the key infrastructure projects that Council has prioritised and budgeted to undertake over the next three years.
These projects will help ensure that we have infrastructure that is fit for the future, connects and protects the taonga that is Te Awa Kairangi ki Tai Lower Hutt, for generations to come.
Campbell Barry Koromatua Mayor179 | Page
THE STRATEGY AT AGLANCE
Vision
Our infrastructure supports Te Awa Kairangi ki Tai Lower Hutt to be a liveable city where all our people thrive: the social, economic, and cultural wellbeing of our community is sustained, and the health and safety of people, property and the environment is protected.
Council owns and manages 1845km of water network pipes and some 486km of roads and footpaths. This Strategy sets out the investment Council will make in core water and roading infrastructure projects over the next 3 years.
What wehavedelivered since2021:
• Tripled investment in water pipe renewals in 2022 and 2023 – compared to the previous 5 years
• Renewed 14.5 km of pipes in 2022-23 compared with 4kms in each year from 2017-2022
• Progressed the Tupua Horo Nuku (Eastern Bays Shared Path) and the Eastern Hutt road resilience projects.
Our infrastructurenetworks facereal challenges:
• Greater demand as the city population grows from 113,00 now to 137,000 by 2043
• Growing pressure from housing intensification, particularly on the valley floor
• An ageing water infrastructure network resulting from historical under investment and constrained regional water storage capacity
• Increased risk of climate induced high rainfall events and sea level rise creating inundation risk
• A lack of sustainable transport choices and increasing traffic congestion.
180 | Page
To address thesechallenges Council will:
• Invest in building, maintaining or renewing critical core infrastructure
• Engage with the community, other councils, and key partners
• Focus on ensuring that environmental standards are met, including water quality
• Take a long term strategic approach to building, maintaining and operating infrastructure
• Make sure that infrastructure investment mitigates the effects of a changing climate
• Make prudent financial decisions that are sustainable into the future and across generations.
Thekey water infrastructureprojects are:
• Pipe renewals
• Seaview Wastewater Treatment Plant
• Gracefield reservoir renewed
• Petone stormwater improvements
• Petone collecting sewer
• New Eastern Hills reservoir and outlet main
• Black Creek stormwater improvements
• Investment in universal smart water meters
Thekey transport infrastructureprojects are:
• Cuba Street overbridge seismic strengthening
• Cross Valley connections
• Subdivision roading improvements
• Eastern Hutt Road resilience
• Connected cycle and pathway network
• Tupua Horo Nuku
One of Council’s core functions is to build and maintain infrastructure which ensures the health and wellbeing of our residents as well as protecting people and property from significant and critical infrastructure risks.
181 | Page
INFRASTRUCTURE SUPPORTSTE AWA KAIRANGI KI TAI LOWER HUTT TO BE A LIVEABLE CITY
The Long-Term Plan gives life to Council’s commitment to making Te Awa Kairangi ki Tai Lower Hutt a connected, resilient, and liveable city where all our residents can connect, thrive, and be part of vibrant neighbourhoods and communities. It supports this commitment by providing infrastructure that is fit for the future and protects the environment. Council achieves this by working closely with the community and other key partners, keeping our changing climate in mind, and operating in a financially sustainable way.
Infrastructure is intergenerational. Built well, infrastructure assets may last for over a century. Investment in infrastructure is lumpy, involving large up-front costs to develop and substantial capital investment when it needs replacing or requires significant maintenance. The long life of infrastructure means that significant cost peaks can be followed by troughs where relatively low expenditure is required.
Te Waihanga (the New Zealand Infrastructure Commission) has stated that New Zealand has under-invested in infrastructure in the past, resulting in lowered service quality, congested infrastructure services and insufficient capacity to support housing growth. Te Awa Kairangi ki Tai similarly faces significant infrastructure challenges, particularly in relation to an ageing water infrastructure network, increased pressure from population growth and the need to mitigate and adapt to our changing climate.
This Strategy articulates Council’s stewardship approach to the management of the core infrastructure in Te Awa Kairangi ki Tai and to meeting the challenges our infrastructure faces.
Council funds infrastructure through a mix of revenue from rates and Council borrowing. Given the significant costs associated with building and maintaining infrastructure, this Strategy sets out the investments in key infrastructure projects that Council has prioritised and budgeted to undertake. This aligns with the LongTerm Plan and Council’s Financial Strategy. Figure 1 below provides a snapshot of the core infrastructure in Te Awa Kairangi ki Tai
182 | Page
- Reservoirs
- Water main
- Pump stations
- Treatment plant
Wastewater
Local roads and footpaths
486
(roads) and
- Sewage trunk mains
- Pump stations
- Storage tanks, and
- Outfall pipeline
- Stormwater mains
- Pump stations
- Roadways and bridges
- Footpaths and walkways
- Cycleways
- Retaining walls and seawalls
- Traffic services, and
- Street lightning
183 | Page
Infrastructure Category Total Length
Components
Figure1:Infrastructurecategory,totallengthandkeycomponents
Key
km
Water Supply 693
(pipes)
666 km (pipes)
Stormwater 463 km (pipes)
km
683
km (footpaths)
WHY INFRASTRUCTURE MATTERS
It is hard to think of any event or activity in Te Awa Kairangi ki Tai that doesn’t use infrastructure. Our homes are connected to, served, and protected by essential water networks, and we access the many facilities in our city by using a connected network of roads and footpaths. Infrastructure provides an important base for our activities; the foundation for our economy to prosper; our people to be healthy, and our city to be safe. In short, infrastructure is critical to sustaining Te Awa Kairangi ki Tai as a connected, resilient, and liveable city.
As the steward of infrastructure assets in Te Awa Kairangi ki Tai, Council wants to ensure that the city’s residents have:
• Safe drinking water
• Wastewater collected from their homes and businesses, treated and safely discharged back into the environment
• Rainfall collected and taken away from their roads and properties to prevent flooding
• the ability to travel easily and safely throughout the city using alternative forms of transport
• Enjoyable public facilities in our community such as parks and reserves.
Infrastructure matters to residents
In responding to Council’s 2023 early engagement on the Long-Term Plan Draft Priorities and Principles, 89% of respondents agreed or strongly agreed that ‘providing infrastructure that is fit for the future’ should be a key area of focus for Council.
There was strong consensus among respondents that infrastructure stands at the core of Council’s duties, and that Council must invest in infrastructure that is not just sustainable but also future-ready, while also balancing the needs of the community and adhering to budgetary constraints.
“We need both the basic infrastructure that allows people to lead their every-day lives comfortably, but we ALSO need to be future-focused and think about what the Hutt needs in 5, 10, 20 years. It's actually not enough to just get the basics right - they're called basics for a reason. The Hutt needs to be ambitious and climate-focused when it comes to infrastructure.” (resident feedback 2023)
184 | Page
Results of Council’s Residents Satisfaction Survey (RSS 2023) shown in Figure2and Figure3 below, indicate a downward trend in resident satisfaction with council owned core infrastructure:


These results demonstrate that residents’ experiences of living in Te Awa Kairangi ki Tai are being impacted by the current state of our infrastructure. With a population that is projected to reach 137,000 by 2043, residents’ experiences are likely to be further negatively impacted unless there is substantial and ongoing investment in building and maintaining the infrastructure in Te Awa Kairangi ki Tai.
Here are some examples of the concerns about our infrastructure identified by residents who took part in the Resident Satisfaction Survey:
"The constant water issues in our area have significantly reduced quality of life. The harbour is frequently unclean to swim in and water pipes have regularly burst in the streets.”
"Because of all the infill housing not required to have off street parks roads are being congested with residents’ cars."
185 | Page
Figure2:Residentsatisfactionsurveyresultsforroads,footpaths&sharedroads
Figure3:Residentsatisfactionforreliabilityofwatersupply,qualityofwater,reliabilityof stormwaterandwastewatersystems
"Infrastructure is seriously underfunded. Water pipes in my neighbourhood burst monthly and leak huge amounts of water onto the roads for weeks or months after being reported before being repaired. The rivers are in a terrible state. Many places I used to swim for my entire childhood have notices up saying they are not safe for swimming or are visibly polluted or filled with massive amounts of sediment."
"Things like footpaths etc have been neglected and are often quite dangerous for older/disabled people. Too many water leaks are left running for long periods." (resident feedback 2023)
Infrastructure in the context of the changing climate
Infrastructure should protect and support people, property, and the environment. The changing climate, however, is increasingly creating challenges and issues for infrastructure networks throughout Aotearoa New Zealand. Te Awa Kairangi ki Tai is no exception to this. Located on a floodplain close to the inter-tidal zone, large parts of the city are vulnerable to natural hazards.
As the effects of our changing climate grow, intense storms and heavy rainfall increase the risk of surface flooding and slips. Rainfall that exceeds the capacity of the stormwater system may enter the wastewater system and create public health risks through human contact with potentially contaminated water. Conversely increased and prolonged dry periods may mean that the water supply is inadequate to meet demand.
Projected sea-level rise of between 50 cm and 80 cm by 2090 means that coastal properties and roads could be swamped or submerged, with an increased likelihood of storm surges damaging seawalls, roads, wharves, and properties. Sealevel rise may also pose a risk of ground salination, threatening the viability of using water from the underground aquifer.
Sea-level rise may also compromise the ability of the stormwater network to drain effectively and further exacerbate the impact of flooding, resulting in some of the city’s key infrastructure, particularly the Seaview Wastewater Treatment Plant, facing inundation.
“We can't keep kicking the climate can down the road like other councils and government groups have been doing for years. The time to take action is now. We will pay for it later on if we don't, so it's cheaper to invest now.”
(resident feedback 2023)
186 | Page
STRATEGY OUTCOMESAND SCOPE
This Infrastructure Strategy builds on Council’s 2018 and 2021 Infrastructure Strategies. It takes the ‘next step’ in a journey to improve Council’s stewardship of the infrastructure assets in Te Awa Kairangi ki Tai and ensure they are fit for the future. The Strategy’s vision supports the aim of Council’s Long-Term Plan to make Te Awa Kairangi ki Tai a liveable city, while the outcomes articulate what the Council wants to deliver.
Outcomes
Council intends to deliver the following outcomes:
• Infrastructure supports the future growth of Te Awa Kairangi ki Tai as a safe, healthy, liveable, and vibrant city
• Improved reliability, resilience, sustainability, and long-term adaptability of our infrastructure
• Improved resident satisfaction with infrastructure that is designed and managed well to meet community needs and aspirations.
Scope
This Strategy addresses the mandatory categories of infrastructure required under the Local Government Act 2002 (LGA):
• Water supply
• Wastewater (sewage treatment and disposal)
• Stormwater drainage and flood protection
• Roads and footpaths.
Categories of infrastructure not covered by this Strategy include:
• Council owned and managed parks and reserves, playgrounds, swimming pools, community facilities such as libraries, halls and integrated hubs, landfill facilities
• Regionally owned and managed ‘bulk’ water supply infrastructure, flood protection, public transport, coastal management, and emergency management services
• Government owned and managed rail corridors, state highways and bridges, schools, hospitals, conservation land, social services, and emergency services
187 | Page
• Privately owned and managed utilities – electricity, gas, and telecommunications.
Council has plans and policies in place to ensure that its other assets are well managed. Council shares or co-manages some infrastructure with other councils in the region, with Upper Hutt City Council and with the New Zealand Transport Agency (Waka Kotahi). Council works closely with these organisations to ensure effective and efficient delivery of infrastructure.
OUR CORE INFRASTRUCTURE NETWORKSINMORE DETAIL
Water Supply
Council’s water supply network receives treated water from the Greater Wellington Regional Council’s bulk water network. The water is stored in local reservoirs and distributed via a pressurised pipe network to consumers at their boundary toby. The water supply network consists of reservoirs, water mains, pumping stations, area meters, and tobies. Critical water supply assets include large diameter pipes, together with all reservoirs and pumping stations.
Most areas of the city meet expected water quality standards for water storage and water pressure, and careful management of this water supply and distribution infrastructure contributes to making sure good health outcomes are maintained.
A view of Council’s water network is provided in Figure4
188 | Page

Wastewater
The wastewater system collects, treats, and disposes of wastewater from residential and business properties, including industrial liquid wastes. The wastewater system consists of a network of pipes connecting to each property, which in turn discharge into a system of larger-diameter trunk sewer pipes.
There are two main trunk sewer pipelines for the Hutt Valley. One follows the western Hutt River stop bank, and the second passes through the eastern suburbs of Taita and Naenae, before following the rail corridor through to Moera. The trunk sewers convey wastewater from Lower Hutt (including Wainuiomata) and Upper Hutt to the Seaview Wastewater Treatment Plant.
Treated liquid effluent from the Seaview plant is dispersed via an outfall at Pencarrow Head, while the treated solid effluent is disposed of at the Silverstream landfill. Resource consents are in place for the discharge of treated wastewater and for overflows in the case of high flows. Ongoing monitoring and environmental scanning ensures compliance with current and potential future resource consents.
189 | Page
Figure 4: The water network at a glance
Critical wastewater assets include large-diameter pipes, trunk pipes, the Seaview Wastewater Treatment Plant, and the Silverstream Storage Tank. Seven out of the 22 pumping stations in the city’s wastewater network are identified as critical assets and these are closely monitored to ensure maintenance and renewals are undertaken when an unacceptable risk of failure is observed or predicted.
The extent of Council’s three water network infrastructure is shown in Figure5


Stormwater and Flood Protection
The stormwater system manages surface water run-off to minimise flooding and any adverse effects on the quality of the water it runs into. The primary stormwater system consists of pipes, open drains, retention dams and pumping stations. Stormwater is directed through streams, rivers, channels, and pipes to the harbour. ‘Secondary flow-paths’ are provided in some areas to accommodate floodwaters when the primary system is overloaded.
Flood protection is important for city planning and development based on management of risk. Components of a robust flood protection system include stop banks to prevent the occurrence of flooding, stormwater management to drain
190 | Page
Figure5:Lengthofthreewaternetworkinfrastructureinkilometresandvalueofthreewater networkinfrastructureinmillions.
water away effectively and efficiently, and land use controls to minimise exposure of property or infrastructure to flood risk.
To help manage storm events, resource consents are in place for when water levels cause discharges into rivers and streams, including intermittent discharges to the Waiwhetū Stream. This includes contaminants from the road such as oil and rubber. Ongoing monitoring and environmental scanning ensures compliance with current and potential future resource consents.
Roading and Footpaths
Council aims to ensure our roading network provides safe, convenient, and efficient transportation through the city. Well-designed road and footpath networks can enhance living environments for residents, and a well-functioning transport network recognises the needs of all road users, including pedestrians and cyclists.
The transport network in Te Awa Kairangi ki Tai comprises roads, footpaths, and roading assets including carparks, walkways, bridges, subways, street lighting, seawalls, and items such as parking meters. Roads and footpaths comprise approximately fifty percent of our total transport infrastructure value, bridges another twenty percent, with the remainder consisting of streetlights, parking meters, signage, and so on. Critical assets include key strategic or arterial routes and bridges.
The Cross Valley Connections Programme aims to improve the accessibility, safety, and resilience of the roading network in southern Lower Hutt. These are represented in Figure 6. This work will support urban growth as well as encouraging alternative modes of transport such as walking and cycling. This is important to address the increased traffic volumes and congestion generated by growth in Petone, Eastern Bays and Wainuiomata. Council’s micro-mobility programme of shared paths and cycleways is designed to promote multi-modal transport, better health outcomes and reduce vehicle emissions.
191 | Page

What wehavedelivered since2021
Council’s investment in infrastructure has increased significantly since 2021. Figure 6 below shows the increasing investment in water and transport infrastructure.

Good progress has been made on Tupua Horo Nuku (Eastern Bays Shared Path) and the Eastern Hutt Road resilience project. Additionally investment in the water network has tripled over the 5-year period and has delivered:
192 | Page
Figure6:criticalassetroutesandcross-valleyconnections
Figure6:HCCcapextrendsoveryears2019-2023
• 14.5 kms of three water pipe renewals in each of 2021-22 and 2022-23, with an estimated 15.3 to be completed in 2023-20242
• A Growth Study to identify future water infrastructure needs
• Design for a new reservoir to meet needs of the valley floor
• Renewal of very high critical assets such as the Barber Grove to Seaview Main Collecting Sewer.
Water networkrenewals: a casestudy in building increased resilience
The Eastern Hills reservoir will be designed to meet the latest national seismic hazard assessment standards and will be built to Importance Level Four (IL4), which is a minimum requirement by Wellington Water Ltd for drinking water reservoirs. This will be accomplished by adopting a sliding base design, flexible pipe connections that can absorb significant earthquake movements, and auto shut off valves that will prevent the uncontrolled release of water from the reservoir if the downstream bulk main fails. Specified structural components will contain and minimise any leakage in the event of an earthquake with a greater than a 1 in 2500 year recurrence.
The Petone Collecting Sewer crosses the Wellington Faultline. To increase the resilience of the Collecting Sewer, designed breakpoints with isolating valves will be installed. This means that in a significant seismic event the pipeline can be isolated and repaired quickly. This project is using a cast iron pipeline that will be lined with new polyethylene pipe which has greater tolerance for movement than the existing asbestos cement pipeline. Polyethylene pipes were also used in the recent renewal of the Barber Grove to Seaview Main Collecting Sewer.
2 This is an increase from an average of 4 kms in each year from 2017-2022. This represents 50% of what WWL recommends Council replaces annually to maintain our water network assets on a lifecycle basis.
193 | Page
THE CHANGING FACE OFTE AWA KAIRANGI KI TAI LOWER HUTT
Growth scenarios show Te Awa Kairangi ki Tai’s population both rising and ageing over the next 30 years, with a corresponding increase in the need for housing and infrastructure services. Housing intensification is visibly evident throughout the city. This higher-density housing has significant implications for our infrastructure.
Council will need to assess whether the condition and capacity of current water services infrastructure can absorb this increasing demand, particularly in areas of high-density housing. Similarly, Council will need to consider whether our transport networks can meet the expectations of a growing population to move easily throughout Te Awa Kairangi ki Tai.
Population Growth
The current population of Te Awa Kairangi ki Tai is estimated to be 113,000. Population growth is likely to be high by historical standards with Council expecting this figure to reach 125,000 by 2033, and 137,000 in 2043. In the past five years, the population has grown through natural increase (more births than deaths) and internal and external migration.
In the year ending June 2023, Aotearoa New Zealand experienced net migration growth of 86,800; the largest number of new migrants since May 2020. External migration will continue to contribute to population growth in Te Awa Kairangi ki Tai, although the largest number of new residents will come from other parts of Aotearoa New Zealand.
Our city’s population is ageing. Rates of projected population growth are highest at ages 50 and over, while the share of the population aged over 70 is expected to rise from 11% to 14% over the next 30 years. The fastest rates of expected growth are in the 80+ age group, while the lowest rates of population growth are expected for people in their 20s
Housing is Intensifying
Te Awa Kairangi ki Tai is experiencing rapid housing intensification. With an increasing population this trend is likely to continue. In 2023, Council amended the District Plan to enable a greater level development in the city (Plan Change 56). This includes permitting three-storey buildings and three units per site in most
194 | Page
residential areas and enabling buildings of six-storeys or more in areas near the city centre, Petone commercial centre and train stations. Plan Change 56 also introduced new restrictions on intensification in some areas, including for the purpose of managing natural hazard risks.
Under Plan Change 56, developments of four residential units or more in residential zones require resource consent. This will allow the capacity of water and transport infrastructure to service the development to be considered on a case-by-case basis. Figure 7 below shows the areas of Te Awa Kairangi ki Tai that will be designated as Medium Density Residential following the adoption of District Plan Change 56.

195 | Page
Figure7:Mediumandhighdensityzones
Urban Renewal - Changing the Central City
Urban renewal is an approach to planning which engages the community and works in partnership with the private sector, to provide new or replace out-of-date amenities, housing, and infrastructure. Te Wai Takamori o Te Awa Kairangi (Riverlink) is an example of urban renewal. Urban renewal can be delivered quickly because it requires less capital expenditure and organisational restructuring than regeneration, which often requires new policy and planning frameworks (see Figure 8 below.)

Council is establishing an Urban Renewal Programme to oversee urban development in Te Awa Kairangi ki Tai and deliver a central city that is thriving, vibrant, and meets the needs of diverse businesses, residents, and visitors. This includes the central city, with investments being made in Te Wai Takamori o Te Awa Kairangi (RiverLink), and through the Infrastructure Acceleration Fund (IAF).
“Council has an obligation to its citizens to provide clean, user-friendly, healthy spaces for recreation, sport and cultural events so as to enhance the wellbeing of its citizens’ mental wellbeing as well as physical wellbeing.” (resident feedback 2023)
196 | Page
Figure8:Urbandevelopmentcontinuum–intensification/renewal/regeneration
TeWai Takamori o Te Awa Kairangi (Riverlink) - Acasestudy in how infrastructureinvestment supports urban renewal
Te Wai Takamori o Te Awa Kairangi is reinvigorating Hutt City, with a focus on attracting people to live, work and invest in the CBD. The key goals of Te Wai
Takamori o Te Awa Kairangi are to reorient the city to face and connect with the Awa and respond to climate change. The project will:
• Deliver Improved flood protection for the Lower Hutt city centre and areas south of the city
• Facilitate city redevelopment
• Provide resilient transport choices allowing all people and businesses to move safely and reliably within the city centre.
Te Wai Takamori o Te Awa Kairangi will enable property development along the river front. This includes the integration of buildings within the stop banks to provide direct physical and visual connections to the Awa. An upgraded stormwater network and wastewater upgrade will support the additional CBD population, as will improvements to the local road network and streetscapes in the areas bounded by Melling Bridge, Ewen Bridge, Cornwall Street and the river.
Flood protection work will combine river channel improvements with soft and hard bank edge erosion protection, maximise the width of river berms, and upgrade stop banks to allow for better flood conveyance and flood security. A key aspect of the flood protection scope of works is improving water quality and biodiversity along the river corridor.
A pedestrian and cycling bridge will connect Margaret Street to Pharazyn Street and Melling Train station will be relocated. The Melling Transport Improvements package of work will increase rail patronage and reduce commuter traffic on State Highway 2 by improving rail services on the Hutt Valley and Wairarapa lines and enhancing park and ride opportunities at stations in Te Awa Kairangi Lower Hutt.
197 | Page
The Infrastructure Acceleration Fund
In 2021, the Government announced the Infrastructure Acceleration Fund (IAF) initiative as part of the Housing Acceleration Fund also announced in 2021. The IAF is designed to allocate funding to new or upgraded infrastructure including transport, three waters and flood management infrastructure. Council received $98.9m of government IAF funding during 2022 to contribute to upgrading and updating stormwater and wastewater networks in the central city and valley floor.
As part of the funding agreement, Council has committed to enabling 3,500 homes to be built in the areas impacted by the water network upgrades. The housing outcomes agreed to in the IAF include:
• A mixture of medium density townhouses and high-density apartments
• Dwellings within a walkable distance of train stations and bus stops
• Proximity to employment, education, recreation, and cultural amenities
• Support from and development opportunities available to mana whenua
• Construction of over 2950 lower cost dwellings and public housing dwellings. The following projects are proposed:
• Melling Stormwater Pipeline - with associated pumpstations, discharging into the river via existing outfalls
• Woburn Stormwater Pipeline - with associated pumpstations, discharging into the river via existing outfalls
• Wastewater Pipeline - Sewer Rising Main, gravity diversions and pumpstations with an associated emergency storage tank. This project is required by the IAF agreement but is not funded by the IAF.
These projects are in the option development phase, with subsequent design to be completed before costs can be determined. The projects are partially IAF funded with Council expected to fund the remainder using development contributions and rates. They will be an integral component of Council’s 2027-2037 Infrastructure Strategy.
198 | Page
THE NATIONAL AND REGIONAL CONTEXT FOR INFRASTRUCTURE
Councils own and manage infrastructure networks in a wider context of legislative settings and national policy frameworks, as well as significant regional and local initiatives. This section sets out key changes that have occurred in the wider context since 2021.
Government’s Water Services Reform Programme
In 2023, the previous Government passed legislation establishing ten regional water services entities to operate, manage and maintain water infrastructure in Aotearoa New Zealand. In December, the new Minister of Local Government, Simeon Brown, announced that the Government will introduce and pass legislation to repeal the previous government’s water services legislation in early 2024.
The repeal bill is the first part of the Government’s new approach to water services delivery, Local Water Done Well, and was enacted in February 2024. The bill repealed former legislation regarding Three Water. Local Water Done Well has a fundamentally different approach to that of the previous Government. It does not require the establishment of and transition to new water services entities. Local Water Done Well recognises the importance of local decision making and flexibility for communities and councils to determine how their water services will be delivered in the future, while still retaining a strong emphasis on water quality and infrastructure investment.
The Minister Brown has indicated that transitional support options will provide flexibility for the needs and circumstances of different councils, and that the repeal bill will include provisions making temporary modifications to local government legislation for the transitional period affecting the 2024 long-term plans.
Te Mana o te Wai and the National Policy Statement for Freshwater Management
Te Mana o te Wai recognises the fundamental importance of water, and that protecting the health of water protects the health and well-being of the wider environment. Te Mana o te Wai is defined in the National Policy Statement for Freshwater Management (2020) as:
199 | Page
• Mana whakahaere: the power, authority, and obligations of tangata whenua to make decisions that maintain, protect, and sustain the health and wellbeing of, and their relationship with, freshwater
• Kaitiakitanga: the obligations of tangata whenua to preserve, restore, enhance, and sustainably use freshwater for the benefit of present and future generations
• Manaakitanga: the process by which tangata whenua show respect, generosity, and care for freshwater and for others
• Governance: the responsibility of those with authority for making decisions about freshwater to do so in a way that prioritises the health and well-being of freshwater now and into the future
• Stewardship: the obligations of all New Zealanders to manage freshwater in a way that ensures it sustains present and future generations.
• Care and respect: the responsibility of all New Zealanders to care for freshwater in providing for the health of the nation.
Council’s stewardship approach to infrastructure, outlined in this Strategy, gives effect to Te Mana o te Wai.
Managing the demand for water
Objective 3b of the National Policy Statement for Freshwater Management is to ‘improve and maximise the efficient allocation and efficient use of water’. Several major New Zealand cities, representing 60% of Aotearoa’s population, have introduced water metering to manage the demand for water, including Auckland, Tauranga and Christchurch.
Councils throughout Aotearoa New Zealand face an increasing demand for water resulting from population growth as well as from water loss caused by the poor condition of water infrastructure. This combination of issues means that councils are having to invest heavily in building or renewing infrastructure, or reducing the demand for water, or both.
In its 2013 report to central government, the Local Government Infrastructure Efficiency Expert Advisory Group stated that the introduction of universal water metering has the potential to offset investment in additional water supply infrastructure. While the costs of water metering need to be carefully considered the experience of councils that have implemented water metering show that charging for water can significantly delay the high capital costs associated with consenting new water sources and building new infrastructure, as well as removing
200 | Page
or reducing the need for seasonal water restrictions. Universal water metering reduces water use by:
• Increasing customer’s awareness of their water use and efficiency of use of water
• Identifying where water losses are occurring
• Developing a better understanding of the overall network balance which can enable councils to reduce water losses.
It is likely that advances in digital smart metering technology will see an increasing expansion of shared water metering programmes by councils, which will enable information to be sent directly to consumers; improve the identification and repair of leaks, and act to reduce the burden of significant infrastructure costs for councils and their ratepayers.
Transport
Effective transport networks that provide a range of low-emission transport options and reduce congestion are critical to sustainable urban and regional development focused on increasing housing supply, choice and affordability, and developing resilient and productive towns and cities.
Government has recently issued its draft Transport Policy Statement for 2024/25 –2033/34 which outlines six strategic priorities:
• Maintain and operate the transport system efficiently to meet current and future needs
• Increase the resilience of the transport system to better cope with natural hazards
• Reduce emissions by transitioning to a lower carbon transport system
• Provide sustainably safer transport for all
• Ensure well-designed and operated transport networks provide reliable, resilient, multi-modal, and low-carbon connections to support productive economic activity
• Enabling people to readily access social, cultural, and economic opportunities through a variety of transport options.
The priority transport projects set out in this Strategy are consistent with and designed to give effect to these priorities.
The forecast growth in population and consequently dwellings is expected to place further demands on the Transport network. In light of the financial pressures and prioritised investment in Three Waters, this is proposed to be managed through specific budget set aside to deal with transport network improvements related to
201 | Page
subdivisions. This funding will be prioritised for critical infrastructure. In addition, the planned projects like RiverLink also provide for transport related growth infrastructure.
Regional and Local Spatial Planning
The Wellington Regional Growth Framework 2021 (The Growth Framework) is the main spatial strategy for the Wellington region and describes a long-term vision for how the region will grow, change, and respond to key urban development challenges and opportunities. The main spatial elements of The Growth Framework for Te Awa Kairangi ki Tai are Future Urban Development Areas in the central Hutt triangle (an area encompassed by the city centre, and Naenae and Woburn Stations), Taitā, Petone North, and Wainuiomata North, as a well as a possible new West-East Growth Corridor between Johnsonville and Wainuiomata.
The Growth Framework identifies a range of regional initiatives required to implement the strategy, including:
• incorporating green infrastructure in new development;
• improving the environmental outcomes from greenfield development; and
• adapting to the impacts of the changing climate.
Some of the planned initiatives that contribute to these outcomes are Tupua Horo Nuku, Food and Green Organics service implementation, and the Reserves investment strategy.
Under Government’s National Policy Statement on Urban Development, councils in specified urban environments (the urban environment comprising Wellington City, Porirua City, Hutt City, Upper Hutt City and Kapiti District councils being one of them) are collectively required to prepare spatial plans known as Future Development Strategies (FDS). The purpose of a FDS is to promote long-term strategic planning. Councils do this by setting out how the local authorities intend to achieve well-functioning urban environments and provide sufficient development capacity over the next 30 years to meet expected demand.
A Future Development Strategy for the Wellington region and Horowhenua is being developed through collaboration between local authorities, central government, and Mana Whenua, and will replace The Growth Framework. Infrastructure is a critical element in the development of the Future Development Strategy because the capacity constraints of existing infrastructure will impact future growth plans
202 | Page
for the Wellington region. Council is also developing a spatial plan for Te Awa Kairangi ki Tai, including consideration of how to provide robust infrastructure networks that are resilient in the face of the impacts of natural hazards.
OUR INFRASTRUCTURE CHALLENGESAND RISKS
Ageing Water Infrastructure
Water infrastructure in Te Awa Kairangi ki Tai is ageing resulting in reduced network resilience, water loss, leakage of wastewater into the environment, and reduced ability to support population growth.
“Our infrastructure is old and very tired, especially sewer and stormwater pipe work and drinking water pipe work, designed, and installed with limited future proofing for the expanding city we now live in. It needs major upgrading now.” (resident feedback 2023)
Determining when assets need renewing is a complex task requiring good information. Some water infrastructure assets are visible, and their condition can be easily observed, while others are underground, making it difficult to forecast when they may fail. WWL uses closed circuit television cameras to check on the condition of the pipe network as well as smoke testing to check whether wastewater infrastructure is operating effectively.
The poor condition of our water infrastructure is evidenced by WWL estimates that throughout the wider region, over 40% of drinking water is being lost due to leaks resulting from ageing infrastructure, historic under-investment, and a backlog of renewals and repairs. They have received record numbers of service requests for leak repairs, with over 3,000 leaks awaiting repair across the Wellington region.
Stormwater Risks
Most of the existing stormwater infrastructure was originally designed to accommodate a five-year “average recurrence interval” rainfall event. Much of this stormwater infrastructure can be overloaded when more severe rainfall is experienced. Service level expectations are now higher than when the system was
203 | Page
designed, and general replacement or renewals are now built to a 10-year average recurrence interval standard.
During wet weather both stormwater and groundwater can infiltrate the wastewater system, leading to possible overloading of the system and overflows which create health, water recreation and water quality issues. Infiltration reduction strategies include pipeline inspection and renewal programmes and are aimed at minimising the entry of stormwater or groundwater to the wastewater system. We are now experiencing more intense rainfall events that put pressure on our stormwater networks. Planning for the effects of rainfall intensity because of the changing climate is being incorporated into design standards and stormwater mitigation solutions. It is not always practical, however, to build our way out of stormwater flooding issues, and case-by-case solutions such as plan changes or overland flow path options must be considered.
Figure 9 below show WWL’s assessment of the condition of the water supply, storm water and wastewater infrastructure in Te Awa Kairangi ki Tai, including the length of pipe infrastructure in each condition category. Condition four (poor) means that the infrastructure has between 5% and 20% of its life remaining, while at Condition five (very poor) the infrastructure has less than 5% of its life remaining, which is around three years.

204 | Page
Figure 9:Assessment ofCondition of Hutt CityWater Infrastructure

The Pressure of Growth on Water Infrastructure
As the population of Te Awa Kairangi ki Tai grows more fresh water is needed per day, with a corresponding demand on the capacity of the wastewater network. WWL estimates that an additional 150,000 people (more than the population of Te Awa Kairangi ki Tai could be living in the wider Wellington region within the next 30 years. It warns that water use in the Wellington region is at an all-time high, primarily due to water loss, population growth and water usage patterns. As more houses are built there will be increased pressure on stormwater networks, including intensive housing creating more solid surface areas with reducing pathways for water to run off, although Council’s draft district plan will require new-builds to incorporate rainwater and greywater capture and use systems.
Council’s Three Waters Growth Study 2022 found that a significant programme of investigative, design and physical works was needed to meet the demands of future growth and bring existing networks up to target levels of service capacity. The study signalled that the possible costs of the interventions proposed in the study had an associated cost estimate of approximately $1.27 billion.
205 | Page
There is increasing pressure on the water storage capacity in the Wellington region as well as on the capacity of its water service networks. Water use restrictions have become a regular occurrence across the Wellington region. In Te Awa Kairangi ki Tai the demand for water will be exacerbated by proposed District Plan changes which will allow for greater housing intensification in parts of the city.
WWL provides the region’s councils with advice on the interventions needed to address leaks and the increasing risk of water shortages. They provided the following recommendations at a regional water shortage summit in September 2023:
• Keep the water in the pipes – invest in finding and fixing leaks, managing water loss and replacing old infrastructure;
• Reduce water demand through water metering – invest in universal smart meters across the metropolitan Wellington region; and
• Add more supply – build another pair of storage lakes to increase supply and complete the existing project to optimise Te Marua capacity.
The challenge facing Te Awa Kairangi ki Tai is further illustrated by WWL’s assessment that the length of water infrastructure pipe renewals achieved in 20222023, and similarly projected for 2023-2024, is about half of what is needed on an annual basis to maintain our water network assets on a lifecycle basis. They note that even if substantive additional funding was made available for water infrastructure renewal, the rate of renewal would be severely limited by the current capacity of the skilled workforce needed to carry out this work.
In summary, despite the increasing investment Council has and will make in water network renewal, current water storage constraints as well as capacity constraints in the regional water infrastructure workforce will impact the level of increased system and network capacity that can be achieved in the short to medium term. In combination with the need for Council to operate with fiscal prudence, this means there are two potentially unavoidable future risks:
• the likelihood of ongoing and potentially increasing water shortages across the Wellington region
• that Council will be unable to provide infrastructure support in all areas of housing development or renew ageing water infrastructure on a lifecycle basis in Te Awa Kairangi ki Tai.
“We've had decades of underinvestment in infrastructure both through national and local government, we have a deficit to address before we even
206 | Page
start planning for our rapid population growth in future.” (resident feedback 2023)
“I am concerned about the housing intensification and the impact this will have on our stormwater and also wastewater. With the significant increase in hard surfaces, the water has nowhere to go but into the stormwater drains, which can’t cope with a wee downpour at the best of times… add 40+ extra houses in the 200m radius around our home showering and flushing the loo on top of a climate crisis and we are going to have significant problems.”
(resident feedback 2023)
Key Transport Infrastructure Challenges
At a regional level, our transport network faces the following challenges:
• A lack of sustainable and attractive transport choices has resulted in an inefficient transport system
• The capacity of the public transport network has limited ability to accommodate future growth or achieve desired changes in people’s transport choices
• The current transport infrastructure isn’t designed to accommodate different forms of transport, leading to increasing conflicts between transport users.
These regional transport challenges are exacerbated in Te Awa Kairangi ki Tai by a fast-growing population and housing intensification, increasing congestion on key routes, and the threats of the changing climate. Te Awa Kairangi ki Tai’s transport network is highly vulnerable to disruption. The city only has two main North-South corridors and limited East-West linkages.
Our transport network lacks resilience to extreme weather, king tides, and seismic events. Some of our largest communities only have a single accessway and any disruption to this accessway could have a significant impact on our communities. Specific transport challenges in Te Awa Kairangi ki Tai include:
• Gaps in the walking and cycling network
• Busy streets and constraints such as the Hutt River and the rail line make it harder to travel by foot or bicycle
207 | Page
• Bus services are not frequent enough, are indirect, and are poorly integrated with rail services
• Roads and footpaths need to be redesigned to accommodate walking and cycling.
Increasing demand for ‘inner-city living’ will put pressure on areas such as the CBD and Petone, lead to changing requirements for road alignment, and speed up the need to move away from car-centric road design. Council wants to make it easier for people to get around using public transport, cycling or on foot by making these options more convenient, integrated, affordable, and attractive. An increase in demand for public transport will need to be accommodated by increased bus services and appropriate infrastructure, such as the provision of space for bus stops and bus lanes.
“Community amenities should be easily accessible to everyone. Relying less on cars and moving to more public transport hubs and walkable city centres/community areas will enable more people to move freely in these areas.” (resident feedback 2023)
The Multiple Effects of a Changing Climate and Natural Hazards
Our changing climate is posing increasingly real challenges to communities across Aotearoa New Zealand and risks to the infrastructure which communities rely on. The significant challenges facing Te Awa Kairangi ki Tai’s infrastructure as a result of more extreme climate events include sea-level rise and increased levels of rainfall.
Projected sea-level rise may compromise the ability of the stormwater network to drain effectively and exacerbate the impacts of flooding. Sea-level rise could also result in some of the city’s key infrastructure, particularly the Seaview Wastewater Treatment Plant, facing inundation, as well as increasing the risk of salination, which could threaten the viability of water from the aquifer. Projected sea-level rise of between 50 cm and 80 cm by 2090 means that coastal properties and roads could be swamped and submerged by water, and an increased likelihood of storms and tsunamis surging inland, damaging seawalls, roads, wharves, and properties.
Increased levels of rainfall that exceed the capacity of the stormwater network may result in groundwater entering the wastewater system, while increasing and prolonged dry periods may result in the water supply not being able to adequately meet demand. Both scenarios create health risks for residents.
208 | Page
“Climate change mitigation and adaptation is essential for survival. Strengthening the natural environment contributes to mitigation (sequestration) as well as promoting biodiversity. Increasing plantings and green spaces will support adaptation by providing shade, and converting areas prone to inundation to reserves will protect residents and businesses. Access to the natural environment supports health and wellbeing.” (resident feedback 2023)
Earthquakes pose a major natural hazard risk for Te Awa Kairangi ki Tai. A rupture of Wellington’s Hikurangi fault could cause extensive subsidence in Petone, liquefaction in floodplain areas, landslides and slope failure in the Western Hills, Eastern Bays and Wainuiomata Hill Road, and tsunami risk in Petone and Eastern Bays.
A significant seismic event could seriously disrupt critical single-access routes, particularly those connecting the Hutt Valley to Wellington, and to Wainuiomata. This loss of access may affect the transport of vital supplies. Any significant damage to roads, underground pipes, stormwater networks, or subsequent overflowing, could affect the ability of roads to function, particularly if heavy rainfall follows a seismic event.
Council’s planning for disaster events focuses on ensuring people have access to clean drinking water and sanitation. More generally the city’s infrastructure needs to be able to withstand a significant earthquake, both regarding structural integrity and regarding maintaining or resuming the provision of services with minimal disruption to the public. This strategy’s multi-asset approach recognises the close integration of transport and water infrastructure networks.
HOWCOUNCIL AIMSTO MEET THESE CHALLENGES
Council is taking a stewardship approach to managing infrastructure in Te Awa Kairangi ki Tai. Put simply, stewardship is about making sure we look after our assets. Council has a responsibility to ensure its infrastructure protects the health and safety of people, property, and the environment. Council’s stewardship approach aligns with the goals of the LTP to ensure Te Awa Kairangi ki Tai is a liveable and vibrant city by providing infrastructure that is fit for the future, and which supports and enhances the environment. Council will do this by engaging with the community, keeping the changing climate uppermost in mind, and making sure its infrastructure investments are financially sustainable. Dimensions of Council’s stewardship approach are described below.
209 | Page
Working with the Community and Partners
Council understands the importance of engaging with the community and stakeholders in planning, funding, and delivering infrastructure to ensure that key projects and decisions reflect community values and ambitions. Council wants to create an ongoing dialogue with the community. Its Community Engagement Strategy outlines Council’s commitment to engaging with the community, including in-depth consultation on major infrastructure projects. This Infrastructure Strategy is an integral part of the Long-Term Plan and the extensive consultation process that has helped shape it.
Close collaboration with key stakeholders such as Waka Kotahi and other Wellington Water Limited shareholder councils is critical to building and maintaining high quality infrastructure. Council wants to ensure that its goals are aligned with the objectives of these organisations to maintain a smooth working relationship and clear focus on infrastructure. Waka Kotahi meets some of the cost of our roading and shared path projects (for example see Te Wai Takamori o Te Awa Kairangi case study). Council works closely with Waka Kotahi as a co-investor in our transport network on the policies and priorities which will impact their funding decisions for this infrastructure.
Supporting and Enhancing the Environment
Water is one of our most important natural resources. Council is focused on ensuring it delivers high quality water and minimising any potential contamination of the water supply. It aims to ensure an adequate supply of water, while balancing this against the environmental impact of water sourcing, through both supply and demand management. Council works closely with WWL to make sure relevant environmental standards are met or exceeded. Council also aims to minimise the unpredicted or accidental occurrence events that can result in stormwater and wastewater infrastructure networks carrying contaminants. Infrastructure can have large practical and visual effects in determining the ‘look’ and ‘liveability’ of Te Awa Kairangi ki Tai, as well as having effects on natural habitats and ecosystems. Council makes every effort to ensure that the integration of infrastructure with the natural environment provides the opportunity to achieve better environmental outcomes and infrastructure amenities. This means ensuring that infrastructure is in place to best serve the community in which it is located, balanced against social and environmental considerations.
210 | Page
Spatial Planning for Future-Fit Infrastructure
Government’s Infrastructure Efficiency Expert Advisory Group and the National Infrastructure Unit of Treasury advocate using a spatial planning approach to drive future investment in infrastructure. Infrastructure needs to take geographical and spatial factors into account. Roads need to be near the land use they serve, while other infrastructure, such as wastewater treatment facilities, is best located away from sensitive land uses.
Spatial planning informs long-term strategy development through the analysis of a wide range of spatial factors: development patterns, natural hazard risks, the natural environment, and infrastructure. Spatial planning aligns these components in a series of maps and diagrams, to illustrate Council’s plans for an area, including the possible types of development for the area and the infrastructure that would be necessary to support development.
Council works actively with the other councils of the Wellington region, central government, and Mana Whenua on spatial planning at a regional scale through the Wellington region’s Future Development Strategy. Council is progressing the development of a city spatial plan to consider how to accommodate our population growth over the next 30 years. This will help inform the future provision of robust infrastructure networks, including infrastructure that is resilient to the impacts of natural hazards.
Mitigating and Adapting to a Changing Climate
The Ministry for the Environment recommends that councils plan for a sea-level rise of between 50cm and 80cm by the 2090s, and continuing rises beyond that. In a 2023 report on coastal inundation and sea level rise assessment for Hutt City District prepared for the Hutt City Council, the National Institute for Water and Atmospheric Research (NIWA) suggest that sea levels are expected to rise by 1.65m to 1.94m by 2130.
The way Council builds and manages infrastructure needs to take the changing climate and increasing climate-related hazards into account. Climate adaptation will be incorporated into the design of new infrastructure projects as well as focusing on making existing infrastructure networks more resilient.
Flood protection in urban areas takes place via stormwater management and is the responsibility of Council. Flood protection through managing significant waterways such as the Hutt River is primarily the responsibility of the Greater Wellington Regional Council. Council works closely with the Regional Council to
211 | Page
develop and implement “catchment environmental strategies” (currently in place for the Hutt River) and Floodplain Management Plans (currently in place for the Hutt River and under development for the Waiwhetu Stream).
Greenhouse gases emitted by transport account for a significant proportion of Te Awa Kairangi ki Tai’s total emissions and have a negative effect on our natural environment and public health. Council will pursue transport networks that enable motor vehicles to travel as efficiently as possible. It will also encourage alternative means of travel, such as walking or biking, and the use of public transport to reduce emissions.
Tupua Horo Nuku (Eastern Bays Shared Path) – a casestudy in climate adaptation
An example of how Council is managing and adapting to our changing climate is Tupua Horo Nuku – the Eastern Bays Shared Path, which is building a 4.4-kilometre walking and cycling path between Eastbourne and Ngā Matau. The design of Tupua Horo Nuku includes mitigating sea and storm surges which currently occur in the Eastern Bays. Tupua Horo Nuku demonstrates a future focused approach to planning, designing, and building infrastructure which protects people, property, and infrastructure.
Sustainable Investment in Infrastructure
Community feedback from the early engagement on the Long Term Plan emphasised financial sustainability as a pivotal concern. The overarching message from the survey underscored Council's duty as a steward of its financial resources, and to balance immediate needs with future challenges, including the changing climate. Respondents indicated a strong desire for long-term infrastructure investments, combined with strategic debt management and a clear focus on Council's intergenerational responsibilities.
“Future funding should always be properly planned with best, likely and worst outcomes projected including risks such as high inflation as it’s very
212 | Page
clear we never projected or resourced for such circumstances which have always been a risk in the past”
“The Council can’t do everything - we need to prioritise spending. Rates cannot keep rising” (resident feedback 2023)
Council funds it’s capital expenditure mainly from borrowing and then spreads the repayment of that borrowing over several years. This enables Council to better match funding with the period over which the benefits will be derived from assets and helps ensure intergenerational equity. Council tries to optimise projects which attract capital subsidies and grants from other government agencies such as Waka Kotahi, and contributions from Upper Hutt City Council, in relation to wastewater activities. Infrastructure projects to accommodate growth may also be partly funded by developers.
Council’s Financial Strategy sets debt to revenue limits and constraints on increasing rates, to ensure its capital expenditures are affordable in the long term. Council therefore prioritises funding the maintenance and renewal of existing core infrastructure assets and will review the timing and scope of large projects to ensure expenditure on assets is made at the most cost-effective time.
Ensuring Levels of Service
Council will comply with all appropriate legislation and standards and ensure that wherever possible our infrastructure meets the needs of today without compromising the needs of our future residents. Sound management of our assets is essential to improving the design, development, and management of our infrastructure. Council’s Activity Management Plans require the levels of service provided by our infrastructure partners to be of a high standard in terms of quality, responsiveness, and timeliness. The following indicators are used to monitor the performance and service provided by city infrastructure:
• Performance measures: performance measures published in the Long Term Plan and reported on in Council’s Annual Report’ allow the community to judge the standard of the infrastructure service
• Customer standards: quality and service availability, target response times for addressing problems with service provision, and courtesy, e.g., keeping property owners informed of system maintenance or other works
• Activity standards: activity standards cover aspects of activity likely to be of concern to the community, such as service quality, customer focus, cost-
213 | Page
effectiveness, environmental performance, and compliance with legal and industry standards
• Management indicators: indicators relating to the performance of assets (e.g., pump stations), and the performance of service contracts.
We do not want the condition of the city’s infrastructure to impact negatively on our communities and have taken steps to solve this by significantly lifting our investment in infrastructure. For example, Council has committed $2.8 million more in operational funding to immediately fix the backlog of leaky pipes. There is also additional operating funding allocated to monitoring and investigations as well as reactive maintenance work to mitigate the risks associated with constrained capital investment over the next 10 years.
This Strategy has been prepared with the expectation that the levels of service will continue at 2023 levels. What the community will see as a result of the increased funding is that critical infrastructure, such as the Seaview Treatment Plant, Gracefield Reservoir and the multi-modal transport corridor connecting Gracefield and State Highway 2 (Cross Valley Connection) will be delivered to improve the capacity and resilience of the water and transport networks. But there are tradeoffs with this approach. Because we are investing within the available funding envelope, we will not be able to address some known issues, such as the backlog of pipe renewals. As a result, people will still experience some loss of service if the infrastructure fails.
We need to remain mindful that even with this investment, we still might not be able to get on top of the work required to prevent asset failure. While the focus of this strategy is for 10 years, there are significant challenges beyond the period of this plan related to the deferred investment and how this will be funded. Overall, Council is satisfied that this approach balances affordability and the investment needed to maintain acceptable levels of service for our communities.
Water Asset Levels of Service
Council is facing big issues with our water infrastructure. The reality is that our water infrastructure has suffered from enormous underinvestment, making it harder for us to meet the needs of our growing city. The largest part of our budget for this 10 Year Plan is being set aside for water infrastructure because we are facing a challenge of leaks in our ageing water infrastructure combined with population growth.
214 | Page
Council is faced with making decisions around increasing our spend on water services to give us all confidence in the quality of our drinking water, the ability of our wastewater systems to maintain a reliable service for our communities. We want Wellington Water Ltd to have the funds to be able to fix more leaks, replace pipes and other ageing infrastructure.
Wellington Water has proposed a significantly higher investment in our water services and the proposal we have indicated as preferred is to invest $1.5 billion over 10 years, but does not fully address all the improvements potentially required but considers the impact of a Rates rise to the rate payers in our community. The other option is to invest $2.6 billion over 10 years which would include a network upgrade and more pipe renewals but may be unaffordable to ratepayers.
Transport Asset Levels of Service
Council has undertaken market testing for delivering the required service levels in asset maintenance and renewals. Overall, there is good confidence for delivering the capital programme required to meet service levels for the immediate term. 35% ($94m) of the Maintenance, Operating and Renewals costs for the next three year has had a robust technical methodology applied for its creation (resealing and pavement rehabilitation). This work was re-tendered in mid-2023. A further 30% ($94m) was re-tendered in mid-2023 for maintenance costs in the street, street lighting maintenance contracts, with cleaning contract being extended for another year.
Validating maintenance performance helps avoid unexpected capital renewal costs and adds to the confidence of the immediate term costs.
The first three years of the capital spend accurately reflects planned service levels, available funding and current supplier costs. For years 4 to 10 in the Long-Term Plan, calculations are indexed against global planning assumptions of the Council’s long-term plan process. There is not necessarily inclusion of new assets maintenance or renewal requirements or contingency costs for condition deterioration beyond economic life thresholds. For periods beyond the 10-year mark, currently maintenance and renewal assumptions are extrapolated from the Long-Term plan into the 30-year horizon. Renewals are generally forecast as incremental rather than with “lumpy” replacement milestones.
215 | Page
IMPLEMENTING THE STRATEGY
Prioritising Investment to Address our Infrastructure Challenges
Core infrastructure is expensive to build and the investment requirement to maintain it can be periodic but significant. Council would like to address all the infrastructure issues experienced by the community as quickly as possible, however there are real funding and other constraints that mean this cannot be the case. There is an obvious tension between the need for investment in infrastructure and the need to stay within the parameters of the Council’s Financial Strategy.
Council’s investment in infrastructure is designed to meet the real and significant challenges described earlier in this Strategy:
• Addressing our ageing infrastructure
• Supporting growth and meeting demand
• Building network resilience
• Adapting to the impacts of a changing climate
The prioritisation of the investments that Council will make in addressing its core infrastructure challenges have been guided by Council’s Financial Strategy and align with the strategic priorities outlined in the Long-Term Plan. Additional factors which have informed this prioritisation include:
• Urgency – what is the urgency of the infrastructure issue?
• Affordability – what level of funding can Council put towards addressing this issue?
• Partnership optimisation – can Council optimise partnership funding for infrastructure?
• Capital achievability – the significant increase in the capital programme, particularly in water services, also carries a level of uncertainty and risk to achievability. Wellington Water and Council has been building capacity and capability over the last few years to improve delivery performance. Through the last 10 year plan 2021-31, we started making changes to address challenges around deliverability. This has included additional operating funding to support WWL to increase capacity and capability, improved planning processes with supply partners and engaging a range of project delivery resources to better manage and deliver projects. Council has also been reviewing its organisational structure and making incremental changes through increased project delivery staff and the functions that support them. It is important to us that there are no delays to the
216 | Page
programme as that may result in not meeting planned levels of service or greater costs in the long term.
This Strategy sets out the priority investments in infrastructure that Council considers prudent, realistic, and achievable, and which optimise the funding available to Council to invest in infrastructure.
Investing in Water Infrastructure
Our greatest water infrastructure challenge is a rapidly ageing water network. Council’s strategic approach to investing in water infrastructure is aligned to that of other councils in the wider region, namely:
• Keeping the water in the pipes by investing in finding and fixing leaks, managing water loss and replacing ageing infrastructure
• Minimising the future cost of water infrastructure by exploring ways of reducing the demand for water and influencing water use behaviour
• Adding more water supply by building additional water storage capacity.
Water Asset management lifecycle
The water asset management lifecycle and renewals are based on an age-based profile and the target renewal rate in partnership with Wellington Water. This does not take into account condition and is intended to ensure that at the end of 30 years, we will have removed the backlog of renewals and be able to reduce the rate of renewals to a long-term, sustainable level that aligns with the rate of deterioration.
Within this renewal profile we prioritise the assets with the worst condition to be renewed. Condition assessments were undertaken in 2022 and 2023 of critical assets, which included 140km of pipe, 25 water reservoirs, 25 pumping stations and the wastewater treatment plant assets. 1358 leaks have been fixed in Lower Hutt since 1 July 2023 (as of 12 December 2023). We renewed 14.5km of pipes in 2022/23. A significant increase from an average of 4km in previous years. Smart water meters do need to be installed and is estimated to cost $78 million over six years.
Tables 1-3 below sets out the key projects to address our ageing water infrastructure, meet the growing demand for water, and build the resilience of our water infrastructure. By far the largest investment will be directed to fixing leaks and renewing the pipe network.
217 | Page
Key project Explanation
Three waters Network Renewals
Seaview Wastewater Treatment Plant
Parts of the water supply, wastewater and stormwater service are in very poor condition. This investment will focus on fixing known leaks and increasing the number of kilometres of the water network which are renewed.
Cost Funding source Time period
$639M 30% funded by UHCC for shared assets only. Remainder through debt and development contributions
2024/25 to 2033/34
Gracefield Reservoir
The Seaview Wastewater Plant is nearing the end of its service life. This project will deliver a number of critical plant system renewals including the sludge dryer, odour control systems, and UV systems.
$195M 30% funded by UHCC (shared asset). Remainder through debt and development contributions
2024/25 to 2034/35
The Gracefield reservoir is in poor condition and this project will deliver a replacement reservoir. This work will occur once the
$34M Debt
2030/31 to 2031/32
218 | Page
Table 1: Addressing Ageing Infrastructure
Key project Explanation
new Eastern Hills reservoir has been commissioned to ensure continuity of supply.
Cost Funding source Time period
Petone Stormwater Improvements
This project will deliver upgrades to the Udy Street stormwater main.
$48M Debt and development contributions
2028/29 to 2033/34
Petone Collecting
Sewer
The main collecting sewer for Petone is at the end of its service life and has been assessed as being highly vulnerable. This project will deliver a replacement collecting sewer.
$83M 30% funded by UHCC (shared asset). Remainder through debt and development contributions
2024/25 to 2029/30
219 | Page
Eastern Hills Reservoir and Outlet Main
Implementing universal smart water meters
There is a water shortage in the Central Hutt water supply zone. This project will support growth on the valley floor and address the existing shortfall in water supply.
$84M Debt and Development contributions 2026/27 to 2028/29
The increasing demand for water will outstrip future water supply capacity and create significant future water related infrastructure costs. Exploring options for managing the demand for water is a key component of regional council’s strategy to reduce the future costs of water infrastructure.
$78M Debt 2024/25 to 2029/30
220 | Page
project Explanation Cost Funding source Time period
Table 2: Meeting Growing Demand
Key
Key project Explanation Cost Funding source Time period
Table 3: Building Network Resilience
This project will address flooding risks and address future stormwater demand.
The graphs below show the relative proportions of Council’s investment in water infrastructure, with the vast bulk of the investment being directed to addressing ageing infrastructure, and to network renewals in particular. This includes detecting and fixing water leaks.
Focussing on critical water assets
The key challenge that Council faces with its water assets is the prioritisation of available investment across an ageing network, due to a constrained borrowing capacity combined with ratepayer affordability in the current economic climate.
This strategy incorporates Council’s decision to substantially increase investment in waters assets over the next 10 years to ensure renewal of all critical assets, such as the Seaview Wastewater Treatment Plant, along with investment in new assets to meet growth expectations on the valley floor. This is to ensure that major outages or disruptions to service are less likely to occur.
What has been excluded from the preferred option is significant investment in renewing local pipe networks. For waterpipes, around 50% of what is required to be renewed has been included and only 10% of wastewater pipes. These will continue to deteriorate with the likelihood of more local outages or disruption to services.
This means that Council has made a decision to defer investment to later years in some local network renewals which is likely to result in a continued level of local network outages and disruption to services.
All water projects in the draft plan, once adopted, will not require a further decision, unless circumstances change (such as new legislative requirements) that require a change. One project that is yet to be determined is the capital investment required to renew or refurbish the main Outfall pipe, but this is some years away from a decision and would likely fall into the 2027-2037 LTP and accompanying Infrastructure Strategy.
221 | Page
Black Creek Stormwater Improvements
$54M
and Development
2024/25 to 2033/34
Debt
contributions
Further decisions will also be required in respect to renewing network discharge consents which are likely to impose level of service improvements. Network improvements required to meet the new Levels of Service will likely require significant investment which is currently not fully known or funded in this strategy
Investing in Water Infrastructure – What We Will See and Impacts on Service Levels
Council received advice on its water assets from WWL. As a result of this advice Council is proposing a significantly higher capital budget for the maintenance and renewal of these assets, although not at the level proposed by WWL due to constraints on debt and rates funding.
The constrained level of investment Council can make in water infrastructure, in combination with the need for WWL to build the necessary workforce capacity, will mean that the water network renewal programme of work will extend beyond the 30-year period of this Infrastructure Strategy. The budgeted spend is expected to result in improvements to the water network over the next 10 years, although the community will continue to experience a level of disruption caused by both the network renewal programme, and from a level of ongoing leaks occurring in the water network.
Council’s investment in its water infrastructure will address both leaks and pipe network renewal ensuring that 18km of pipes are replaced in 2024/25, rising towards 30km per year from 2030 onwards. This includes the pipes leading to the Seaview Wastewater Treatment Plant and scoping work in relation to renewal of the pipe running from the plant to the outfall at Pencarrow. A recently completed comprehensive condition assessment of the Seaview Waste Water Treatment Plant indicated a need for urgent investment in renewing critical plant items over the next three years. $195M has been included in the first ten years of this Strategy to address this.
Partnership Funded Water Infrastructure
As outlined earlier, Government announced the Infrastructure Acceleration Fund (IAF) initiative in 2021. The IAF is designed to allocate government funding to new or upgraded infrastructure including transport, water and flood management infrastructure. Council secured $98.9million of government IAF funding in 2022 to contribute to upgrading and updating the stormwater networks in the central city and valley floor.
The following projects have been proposed:
222 | Page
• Melling Stormwater Pipeline – with associated pumpstations, discharging into the river via existing outfalls.
• Woburn Stormwater Pipeline – with associated pumpstations, discharging into the river via existing outfalls.
• Wastewater Pipeline – Sewer Rising Main, gravity diversions and pumpstations with an associated emergency storage tank. This project is required by the IAF agreement but is not funded by the IAF.
These projects are in the option development phase, with subsequent design to be completed before costs can be determined. The projects are partially IAF funded with Council expected to fund the remainder using development contributions and rates. They will be an integral component of Council’s 2027-2037 Infrastructure Strategy.
Investing in Transport Infrastructure
Council’s Transport Plan sets out an ongoing programme of work to maintain, operate and renew the roading network in Te Awa Kairangi Lower Hutt. This programme includes roading, cycle path, footpath and environmental maintenance. The aim of this programme of work is to ensure that the city has a resilient and sustainable transport system that provides the community with transport options that connect people easily, safely, and affordably to where they need to go, whether they go by bike, foot, public transport, or car.
In addition to this ongoing programme of work Council will be investing in key transport projects designed to address ageing roading infrastructure, meet the growing demand on the city’s roading network, building the resilience of our roading network, and ensuring the roading network is adapting to the impacts of the changing climate. These key projects are set out in Tables 4-7 below.
Transport Asset management lifecycle
The transport asset management lifecycle refers to Council’s systematic approach to managing its transport assets (roads, footpaths, lighting and cycleways) efficiently throughout their lifespan. By managing assets throughout this lifecycle, Council can optimise asset use, minimise costs, and ensure the safety, reliability, and efficiency of transportation networks in Te Awa Kairangi ki Tai Lower Hutt.
The outcomes from a 2020 Investment Logic Mapping Problem Definition workshop were reviewed and updated for inclusion in the 2023 Asset Management Plan and 2024-2034 Long-Term Plan. There were three focus areas:
1. Network compliance (to address aging infrastructure)
223 | Page
2. Network resilience (resilience/ Environmental considerations)
3.
Network future capacity
To provide greater funding certainty and confidence, work has begun at Council to undertake long-term condition assessments, by asset class including cyclical renewal profiles. When completed, these will be aligned with the forward plan of asset construction to inform longer-term maintenance and renewals plan (including costs) which are currently not available.
Detailed condition reports will commence by mid-2024. In parallel with this work, Council is improving the level of internal technical capability and asset management systems needed to support this activity. By working to understand capital renewal requirements beyond the first three years, we will be able to provide greater confidence around forecasting assumptions in the future. In light of the financial pressures due to funding constraints, investment in waters infrastructure has been prioritised, with funding in Transport being mainly focused on Maintenance, Operations and renewals (MOR) projects as well as those with significant partner funding.
224 | Page
Key project Explanation Cost Funding source Time period Seismic strengthening of Cuba street overbridge Seismic strengthening to improve the resilience of the bridge. $1.3M Debt 2023-25
Table 4: Addressing Ageing Infrastructure
225 | Page
Key project Explanation Cost Funding source Timeperiod Subdivision roading improvements Improving access and road resilience to new developments $39M 51% of programme subsidy funded, remainder debt and development contributions 2024-34
Table 5: Meeting growing demand
Key project Explanation Cost Funding source Timeperiod Eastern Hutt Road resilience Improvements to the resilience of Eastern Hutt Road. $45.87m Largely debt with some grant funding 2023-31 Cross Valley connections A new multi-modal transport corridor connecting Gracefield and State Highway 2. $188.8m 51% of programme subsidy funded, remainder debt and development contributions 2022-32
Table 6: Building Network Resilience
Key project Explanation Cost Funding source Timeperiod
Cycleway and micromobility programme A programme of investment towards a connected cycle and pathway network across Hutt City.
$60.4m 51% of programme subsidy funded, remainder debt and development contributions
2022-31
Key project Explanation Cost Funding source Time period
Tupua
Horo Nuku
Construction of a new shared path between Windy Point and Point Howard to provide safer walking and cycling and construction of a new sea wall to improve the resilience of the road.
$79.9M Around 30% through debt and the rest of funding provided by Waka Kotahi/ NZTA and Crown Infrastructure Partners
2022 – 2026
226 | Page
Table 7: Adapting to the Changing Climate
Investing in Transport Infrastructure - what we will see and impacts on service levels
Council’s Integrated transport strategy developed in 2022 identified some key challenges for our transport network. This strategy sets out a 10 year plan designed to ensure the roading network is well maintained to allow for vehicle movement with a high level of safety and a low level of delays, ensure footpaths are smooth and free of hazards, and provide cycle lanes which give separation from heavy traffic.
Council has prioritised the areas most in need of renewals through the conditioning rating survey and testing done by our consultants. Further work will be undertaken to create a 10-year renewals plan which will form the basis of the next Long-Term Plan.
To provide greater certainty over long-term renewals, work has begun to ensure that we have an evidence-based future work programme that stipulates the required maintenance and renewals requirements to maintain and renew transport assets. This draft Long-Term Plan has been set based on the existing levels of service as a 10-year programme is developed ahead of the next LongTerm Plan.
The Integrated Transport Strategy 2022 is expected to improve the overall condition of the transport network in Te Awa Kairangi ki Tai over the next 10 years. The key projects outlined above will make a significant contribution to the objectives of the Integrated Transport Strategy by improving the resilience of key transport corridors, investing in a cycle and pathway network and, critically, future proofing the transport network so that it is able to meet the needs of a growing population.
While funding constraints have played a role in deciding the transport investments set out in this Strategy, these projects are expected to improve the overall condition of the transport network over the next 10 years. Government’s transport priorities are yet to be finalised and it is likely that further changes may be required in future plans to reflect these priorities.
Significant upcoming decisions for transport infrastructure
All bridges are subject to contracted periodic assessments.
A forward schedule is created based on the assessed
The funding subsidy for this has been included in the 2021-24 NLTP and is subject to extension approval by NZTA.
Key project Significant decisions made Significant decisions to be made Seismic strengthening of Cuba street overbridge
227 | Page
Key project Significant decisions made Significant decisions to be made criteria. The decision to undertake strengthening was made prior to 2021 and included in the relevant LTP documents.
Subdivision roading improvements
Eastern Hutt Road resilience
To provide for additional funding in the LTP 2024 and NLTP 2024-27 subsidy submission to address this project, This cost has also been factored into the Development Contribution work that will be consulted on in the draft Long-Term Plan.
To provide for additional funding in the LTP 2024 and NLTP 2024-27 subsidy submission to address this project,
If funding was not approved by NZTA, or cost estimates exceed LTP estimates, this could require further Council decisions.
Cross Valley connections
Cycleway and micro-mobility programme
The business case for this programme was approved by Council and NZTA in 2021.
To provide additional funding in the LTP 2024 and NLTP 2024-27 subsidy submissionfor the next phases of work.
The business case for this programme was approved by Council and NZTA in 2021.
To provide additional funding in the LTP 2024 and NLTP 2024-27 subsidy submissionfor the next phases of work..
If funding was not approved by NZTA, or cost estimates exceed LTP estimates, this this could require further Council decisions. The EHR business case included a cycleway which has been split out and included in the Cycleway and micro-mobility programme.
If funding for one, but not the other, was approved by NZTA, this could require a decision by Council to fund 100% the project not subsidised by NZTA.
If funding is not approved by NZTA, or cost estimates exceed LTP estimates, this could require further Council decisions.
If NZTA or Government transport funding priorities change, this may impact this programme and Council may face significant decisions.
If funding is not approved by NZTA, or cost estimates exceed LTP estimates, this could require further Council decisions.
If NZTA or Government transport funding priorities change, this may impact this programme and
228 | Page
ASSUMPTIONSINFORMING THE STRATEGY
Life cycles of significant transport infrastructure assets
Lifecycle management of transport assets is set out in section 2.7.7 of the Tranpsort Asset Management Plan (AMP). This approach assumes that management through an asset’s life cycle to maximise its usable life is coupled with, targeted interventions to optimise asset life, level of service, and funding requirements. A performance and gap analysis (AMP section 3.3) sets out the application of this targeting which informs forward works planning.
Growth or decline in the demand for relevant services
The current population of Te Awa Kairangi ki Tai Lower Hutt is about 113,000. We’re expecting this figure to reach 125,000 by 2033. Population growth of this scale is putting huge pressure on our supply of houses and infrastructure like pipes and roads. Council’s investment projections incorporate the policy position which requires developers of new houses to contribute to the cost of growth-related infrastructure such as the cost of the pipes and roads to help support our increasing population
Increases or decreases in relevant levels of service
Our planned investment in water and transport infrastructure in the 10 Year Plan is expected to maintain current levels of service for the duration of the plan. For example, we have committed $2.8 million more operational funding to immediately fix the backlog of leaky pipes. This will help maintain our current service levels. Even with this investment, some uncertainty remains. The budgeted spend on water is expected to result in improvements to the water network over the next 10 years, although the community will continue to experience a level of disruption caused by both the network renewal programme, and from a level of ongoing leaks occurring in the water network. While we are satisfied that our approach balances affordability and the investment needed to maintain acceptable levels of service for our communities, we are also mindful that this will require us to make the assets last longer than what Wellington Water Limited has advised.
229 | Page
Key project Significant decisions made
Significant decisions to be made Council may face significant decisions.
While funding constraints have played a role in deciding the transport investments set out in this Strategy, these projects are expected to maintain the overall condition of the transport network over the next 10 years. Government’s transport priorities are yet to be finalised and it is likely that further changes may be required in future plans to reflect these priorities and subsequent impacts on levels of service
Government’s Water Services Reform Programme
The Government has advised that it will be repealing the legislation enacted by the previous government for water reform. The repeal bill is the first part of the Government’s new approach to water services delivery, Water Done Well, which recognises the importance of local decision making and flexibility for communities and councils to determine how their water services will be delivered in the future, while still retaining a strong emphasis on water quality and infrastructure investment.
Council has prepared this Strategy on the assumption that it will remain responsible for water related infrastructure assets.
Funding and Financial Sustainability
Council’s Financial Strategy focuses on the next 10 years. Council will fund the projects outlined in this Strategy through a mixture of general and targeted rates, as well as user subsidies, grants, fees, and charges and development contributions. Council manages borrowing and repayments within the framework specified in the Liability Management section of the Treasury Risk Management Policy. Council’s Financial Strategy further sets debt to revenue limits and constraints on increasing rates in the long term. Council has therefore given priority funding to maintaining and renewing its existing assets and will review the timing and scope of large projects to ensure future expenditure on assets is done at the most cost-effective time. Council will also optimise funding from other government agencies and development contributions.
There are funding challenges associated with the deferred programme of investment in years 11-30 which can potentially only be addressed through additional funding from Central government or reduction in service levels. There is a large degree of uncertainty as to how this will be managed.
230 | Page
The Condition of Water Assets
Although the condition of Council’s water network is expected to improve significantly over the period of this strategy, condition assessments for these assets may reveal that they have aged faster than our modelling anticipates. WWL has made assumptions regarding the average useful lives and remaining lives of the current asset groups, based on current local knowledge, experience, and historical trends. These need to be reviewed and accuracy improved based on physical inspections and assessments of deterioration.
FINANCIAL PROJECTIONS
The projections included below (Figures 10-15) relate to the proposed Three Waters and Transport capital investment included in the Draft Long-Term Plan 2024-34.

The step up in opex from year 11 onward is as a result of the unconstrained capital programme from this point which has direct associated operating costs such as depreciation. Additional opex has been built into years 1-10 to manage monitoring, investigations, and maintenance activities to offset the capital funding at levels lower than recommended for Three Waters.
231 | Page
Figure 10: Total capital andoperational expenditure

Year 11 onwards represents a capital programme unconstrained by funding limitations and is at the required levels to deal with renewals and backlog for Three Waters. There is significant uncertainty associated with how this will be funded in the future.

232 | Page
Figure 11: Total capital expenditure by groupofactivity
Figure 12:Transport capital expenditure


233 | Page
Figure 13: DrinkingWater capital expenditure
Figure 14: Wastewater capital expenditure
Figure 15: Stormwater capital expenditure
APPENDIX1
Local Government Act requirements relating to InfrastructureStrategies
101B Infrastructurestrategy
(1) A local authority must, as part of its long-term plan, prepare and adopt an infrastructure strategy for a period of at least 30 consecutive financial years.
(2) The purpose of the infrastructure strategy is to—
(a) identifysignificantinfrastructure issues for the local authority over the period covered by the strategy; and
(b)identify theprincipaloptions for managing those issues and the implications of those options.
(3) The infrastructure strategy must outline how the local authority intends to manage its infrastructure assets, taking into account the need to—
(a) renew or replace existing assets; and
(b) respond to growth or decline in the demand for services reliant on those assets; and
(c) allowfor planned increases or decreases in levels of service provided through those assets; and
(d) maintain or improve public health and environmental outcomes or mitigate adverse effects on them; and
(e) provide for the resilience of infrastructure assets by identifying and managing risks relating to natural hazardsand by making appropriate financialprovisionfor those risks.
(4) The infrastructure strategy must outline the most likely scenario for the management of the local authority’s infrastructure assets over the period of the strategy and, in that context, must
(a) show indicative estimates of the projected capital and operating expenditure associated with the management of those assets
(i) in each of the first 10 years covered by the strategy; and
(ii) in each subsequent period of 5 years covered by the strategy; and
(b) identify
(i) the significant decisions about capital expenditure the local authority expects it will be required to make; and
(ii) when the local authority expects those decisions will be required; and
(iii) for eachdecision, the principal options the localauthority expects to have to consider; and
(iv) the approximate scale or extent of the costs associated witheach decision;
234 | Page
and
(c) include the following assumptions on which the scenario is based:
(i) the assumptions of the local authority about the life cycle of significant infrastructure assets:
(ii) the assumptions of the local authority about growth or decline in the demand for relevant services:
(iii) the assumptions of the localauthority about increases or decreases in relevant levels of service; and
(d) if assumptions referred to in paragraph (c) involve a high level of uncertainty,—
(i) identifythe nature of that uncertainty; and
(ii) include anoutline of the potential effects of that uncertainty.
(4a) A local authority must, for a long-term plan for or after 2027–2037, identify and explain, in the infrastructure strategy, any significant connections with, or interdependencies between,
(a) the matters included in that infrastructure strategy; and
(b) the matters that are
(i) included inan infrastructure strategy prepared and adopted by a water services entity under section 157 (and see alsoclause 16 of Schedule 1) of the Water Services Entities Act2022; and
(ii) relevant to the localauthority’s districtor region.
(5) A local authority may meet the requirements of section 101A and this section by adopting a single financial and infrastructure strategy document as part of its long-term plan.
(6) In this section, infrastructure assets include
(a) existing or proposed assets to be used toprovide services by or on behalf of the local authority in relation to thefollowing groups of activities:
(i) water supply:
(ii) sewerage and the treatment and disposalof sewage:
(iii) stormwater drainage:
(iv) flood protection and control works:
(v) the provision of roadsand footpaths; and
(b) any other assets that the local authority, inits discretion, wishes to include in the strategy.
235 | Page
Significance and engagement policy
All councils are required to have a Significance and Engagement Policy under the Local Government Act 2002. The policy must be reviewed every three years.
Council must ensure that the community receives every opportunity to engage with the decision-making process, particularly in cases where the decision is significant and may represent a material departure from an existing policy.
Our Significance and Engagement Policy sets out the general approach that Hutt City Council will take to determining the significance of proposals and decisions relating to issues, assets or other matters. It also sets out the criteria or procedures that are to be used by Hutt City Council in assessing the extent to which issues, proposals, assets, decisions, or activities are significant or may have significant consequences. For the community, the policy clarifies how and when communities can expect to be engaged in decisions about different matters
You can read the full Significance and Engagement Policy here: [LINK]
236 | Page
Development and financial contributions policy
The Development and Financial Contributions policy is a key part of our funding toolkit, helping to provide funding for growth-related infrastructure. The policy is aligned to our Financial Strategy principle of “growth pays for growth”. This means allocating costs and charges where they fall. Council can impose both development and financial contributions to help fund growth related infrastructure, but these must not both be imposed on a development for the same purpose.
Councils can require financial contributions to be made under s108 (2)(a) of the Resource Management Act 1996 through setting conditions requiring a contribution of money or land or can be a combination of the two (s108(9)). Financial contribution charges are established through the District Plan and summarised in the Development and Financial Contributions Policy
Development contributions are payments made to council by developers towards the costs of planned infrastructure required such as water services or roading, to meet the future needs of the growing community. Development contributions are levied on development and are established in a Development and Financial Contributions Policy, which the Council must review every three years.
The purpose of the Policy is to ensure that a fair, equitable, and proportionate share of the cost of infrastructure is funded by development.
You can review Council’s full proposed Development and Financial Contributions policy here: [LINK]
237 | Page
Ratesremissionpolicy
Councils can have a Rates Remission Policy to provide relief from rates. These are set in accordance with section 102(3) of the Local Government Act 2002.
A Rates Remission Policy provides a reduction in the amount of rates payable on a property.
Council has developed a proposed a Rates Remission for this 10 Year Plan. Our proposed Rates Remission Policy will grant relief in nine different scenarios including some rates for schools and up to $250 towards the rates for those on a low-income.
Check out the full proposed policy in our supporting documents <link>
238 | Page
Ratespostponementpolicy
Councils can have a Rates Postponement Policy to provide relief from rates. These are set in accordance with section 102(3) of the Local Government Act 2002.
A Rates Postponement Policy delays the need for rates to be paid to a point in the future.
Council has reviewed the Rates Postponement Policy for this 10 year plan and is proposing no changes. Our Rates Postponement Policy can help some small businesses and those experiencing financial hardship.
Check out the full proposed policy in our supporting documents <link>
239 | Page
Ngā ringaringa me ngā waewae o
Te Kaunihera - Council controlled organisations
240 | Page
Seaview Marina Limited
Objectives:
Council’s objective for Seaview Marina Ltd (SML) is for it to own and operate Seaview Marina.
Natureandscopeofitsactivities:
Seaview Marina Limited (the Company) is responsible for the operation of the boating facilities and services, the maintenance of infrastructural assets and the development of additional facilities and services as demand dictates.
Council requires SML to own and operate Seaview Marina as a facility for the enjoyment of Te Awa Kairangi ki Tai Lower Hutt community and to support charitable non-profit ventures with a marine focus without compromising its commercial objectives and environmental responsibilities. KeyPerformanceIndicators
241 | Page
Key Performance Indicator 2024/25 2025/26 2026/27 Reporting Frequency Financial 1 Deliver thetotal annualbudgeted income Achieve 100% of total budgeted income Achieve 100% of total budgeted income Achieve 100% of total budgeted income Six monthly 2 Deliver thetotal annualbudgeted net surplus Net surplus within budget Net surplus within budget Net surplus within budget Six monthly 3 Achieve prescribed rate ofreturn on equity before taxand dividends (2) 0.4% 0.2% 0.2% Annually
242 | Page 4 Manage Capital Expenditure (3) Complete within capital budget Complete within capital budget Complete within capital budget Annually Relationship& Communication 5 Client Service & Customer Needs 85% satisfaction in the biannual survey Bi-Annually 6 Special interest messages Complete four messages per annum Complete four messages per annum Complete four messages per annum Four per annum 7 Meet all shareholder reporting deadlines SeeSection 11 ofthe Statement of Intent SeeSection 11 ofthe Statement of Intent SeeSection 11 of the Statement of Intent Schedule in Section 11 ofthe Statement of Intent Risk Management andHuman Resources 8 Notifiable health and safety incidents None None None Monthly to board 9 Staff Satisfaction Achieve 85% staff satisfaction Achieve 85% staff satisfaction Achieve 85% staff satisfaction Annually Marketing 10 Implement strategy to improve occupancy rates (4) Berth occupancy equal or greaterthan 80% (4) Berth occupancy equal or greaterthan 83% Berth occupancy equal or greaterthan 86% Bi-Monthly Non- Financial
12
To provide financialor non- financialsupport to at least three charitable (nonprofit) ventureswith a marine focusduring any given financial year.
Support to at least three organisation s Support to at least three organisation s
Support to at least three organisation s
13 Public benefit Perform survey of public opinion on marina facilities (duringthird quarter)
Environmental
14
Reduce direct emissions
15
Fleet and equipment
Reduce direct emissionsby 50% by 2030, and achieve net zero emissionsby 2050
Equipment or vehicles utilising fossil fuels to be phased out by equipment or vehicles that are electric or utilise other low carbon alternative.
Reduce direct emissionsby 50% by 2030, and achieve net zero emissionsby 2050
Equipment or vehicles utilising fossil fuels to be phased out by equipment or vehicles that are electric or utilise other low carbon alternative.
Reduce direct emissionsby 50% by 2030, and achieve net zero emissionsby 2050
Equipment or vehicles utilising fossil fuels to be phased out by equipment or vehicles that are electric or utilise other low carbon alternative.
Annually
Bi-Annually
Annual footprint report provided by HCC
Annually
243 | Page
Notes to Performance Measures
1. Operational expenses are defined as all expenses controllable by Seaview Management. Excludes depreciation and finance charges and losses arising from the revaluation of similar assets within an asset class.
2. Return on equity is defined as net Surplus / (Deficit) before tax and dividends and excluding losses or gains arising from the revaluation of similar assets within an asset class divided by the opening balance of equity at the start of the year.
3. Excludes carry forward of expenses on projects from prior years, unless specifically budgeted for (e.g., where project spans two or more fiscal periods). Refers to the total capital budget.
4. March 2022 saw an occupancy high of 89%. More recent wider pricing pressure has seen occupancy decline to 82% in February 2023, where it has hovered since. Occupancy strategies can be expected to return previous high occupancy levels at a gradual rate.
244 | Page
Urban Plus Limited
The Urban Plus Group comprises Urban Plus Ltd (UPL), UPL Developments Ltd and UPL Ltd Partnership.
Objectives:
Council’s objective for UPL is for it to own and operate a portfolio of rental housing and develop property in preparation for sale or lease. The company’s activities include property development, rental property management, provision of strategic property advice to Council and the purchase of surplus property from Council for development.
Natureandscopeofitsactivities:
UPL was established in 2007 as a specialist property company charged with supporting the objectives of Council by providing housing outcomes for Lower Hutt. UPL has managed and invested into its portfolio of social housing since it took ownership of the portfolio from Council in 2007. UPL also provides specialist property services and advice to Council and is involved in a range of development activities.
UPL’s primary focus has been on delivering social housing for low-income elderly and releasing affordable and market housing for sale. Council’s expectation is that UPL continues the delivery of wider housing outcomes and benefits.
Key performanceindicators: Rental
1.1
245 | Page
Housing
Capital expenditure within budget.
Operational expenditure within budget.
Net Surplus before Depreciation and tax and after Finance Expenses as a Proportion of the Net Book Value of Residential Land and Buildings at the Start of the Year – Greater than 2.25%.
1.2
1.3
1.4 Tenant satisfaction with the provision of the company’s rental housing greater than or equal to 90%.
1.5 Percentage of total housing units occupied by low-income elderly3 greater than or equal to 90%.
1.6 Annual rental increases to be no greater than $50 per week per unit.
1.7 Increasing the portfolio size to 220 units by December 2025.
1.8 Any rental housing units purchased and not already utilising electricity or renewable sources of energy for space heating, water heating, and cooking facilities, shall be converted to utilise only electricity or renewable sources of energy within five years of acquisition.
1.9 New rental housing units constructed by UPL to utilise only electricity or renewable sources of energy for space heating, water heating and cooking facilities.
Property Development
1.10 Capital expenditure within budget.
1.11 Operational expenditure within budget.
1.12 All new developments shall only utilise electricity or renewable sources of energy for space heating, water heating and cooking facilities.
1.13 All new housing units (standalone house or townhouse) shall achieve a certified HomeStardesign rating of at least six stars 4
3 ’Aged 65-plus’ in this context relates to an applicant for a residential tenancy, that at the time of application, is able to demonstrate:
i. that they are eligible for National Super (aged over 65 years – this being subject to review periodically by Central Government);
ii. that they have no other income;
iii. that they do not have cash or assets of such a magnitude that would mean they could make independent accommodation choices.
4 The assessment criteria being: Either - an independent review by a certified HCC Homestar Assessor to qualify the design would satisfy and meet the appropriate the Homestar 6 standards for each UPL project –Or, via a formal registration and certification process via NZGBC. The decision on which option to utilise is at the discretion of UPL officers in terms of financial impact to projects on a case-by-case basis.
246 | Page
1.14 A pre-tax return of not less than 15% on Development Costs including Margin and Contingency on housing released to market (except where the Board and Shareholder agree otherwise to achieve specified objectives).
1.15 Value of divestment to Community Housing Providers (or socially likeminded organisations) set at each project’s Development Cost (includes contingency and GST) plus a margin of no greater than 12.5% (except where the UPL Board and Shareholder agree otherwise to achieve specified objectives).
1.16 Long term public rental accommodation pre-tax returns at no less than (or equal to) 3.0% after depreciation5
Professional Property Advice
1.17 Achieve a market return on additional services provided to the Shareholder.
UPL Developments Limited
1.18 Undertake, negotiate and execute tender and procurement processes for and on behalf of the Partnership and ‘parent’ company as required.
1.19 Facilitate civil and construction contracts for and on behalf of the Partnership and ‘parent’ company as required.
1.20Facilitate payment of contract progress claims for Board approved contracts as well as payments to other suppliers engaged to provide services or goods to defined development projects.
1.21 Should UPLDL be used for future developments, the same performance measures apply as for Property Development (refer above).
1.22Act as General Partner when a Limited Partnership structure is utilised for development projects.
UPL Limited Partnership
1.23 Develop land in a manner which maximises its value at a level of risk appropriate for the investment of funds.
5 Returns are specific to each project’s (Board Approved) business case where long term market rentals are developed. Future rents are set as per independent annual review.
247 | Page
1.24 To perform business undertakings in common with UPL with a view to profit from development projects for the purposes of funding for the elderly housing portfolio and meeting the Shareholder’s wider key priority outcomes.
1.25 Should UPLLP be used for future developments, the same performance measures apply as for Property Development (refer above).
Wellington Water Limited
Objectives:
Wellington Water Ltd (WWL) fully manages, under contract, drinking water, wastewater and stormwater (Water services) for Hutt City Council. It provides safe and environmentally sustainable services to Council with a focus on contracted service delivery for the operation, maintenance and ongoing development of drinking water, stormwater and wastewater assets and services, and asset management planning. WWL operates as a business on a non-profit basis.
Natureandscopeofitsactivities:
WWL manages the Three Waters networks through a pool of expert staff and resources available to the region. Shareholding councils are Lower Hutt, Wellington, Porirua and Upper Hutt City Councils, along with the South Wairarapa District Council. WWL also manages the bulk water assets for the Greater Wellington Regional Council.
Performancemeasures
WWL provides a reliable water supply, wastewater and stormwater management service to Council. Its key performance measures for each of the Three Waters activities are outlined in section two of the draft annual plan.
248 | Page
Hō mātou pūtea - Our finances
249 | Page
Financial statements
250 | Page
PROSPECTIVESTATEMENTOFCOMPREHENSIVEREVENUEANDEXPENSE Fortheyearending30June Forecast Draftbudget Forecast Forecast Forecast Forecast Forecast Forecast Forecast Forecast Forecast 2024 2025 2026 2027 2028 2029 2030 2031 2032 2033 2034 $000 $000 $000 $000 $000 $000 $000 $000 $000 $000 $000 REVENUE Ratesfunding 95,074 111,890 123,449 137,164 146,316 160,039 181,507 197,408 219,105 240,211 261,217 TargetedRates 60,538 71,732 83,860 97,718 117,691 135,385 149,072 159,948 167,197 177,381 190,200 Usercharges 58,637 69,303 74,177 76,717 79,378 81,402 83,609 85,767 87,688 89,726 91,737 Operatingsubsidies 9,160 12,130 12,432 12,741 13,027 13,345 13,655 13,771 14,046 14,314 14,588 Operatinggrants 58 22 23 23 24 25 25 25 26 26 27 Capitalsubsidies 21,788 41,478 47,465 16,310 35,328 45,134 31,564 33,070 22,383 10,248 10,442 CapitalGrants 36,113 27,359 41,031 36,232 12,742 - - - - -Development&financialcontributions 4,985 12,222 14,796 16,440 17,101 17,382 20,397 19,903 19,321 18,932 19,029 Vestedassets 903 936 954 976 999 1,021 1,043 1,064 1,086 1,107 1,128 Interestearned 3,238 4,200 2,939 2,988 3,041 3,106 3,184 3,231 3,283 3,358 3,435 DividendsfromCCOs 204 204 208 213 218 223 228 232 237 241 246 Gain/(loss)ondisposalofassets - - - - - - - - - -Otherrevenue 6,132 6,270 6,640 5,436 5,562 5,933 5,803 5,919 6,302 6,184 6,302 Totalrevenue 296,830 357,746 407,974 402,958 431,427 462,995 490,087 520,338 540,674 561,728 598,351 EXPENDITURE Employeecosts 45,371 52,604 54,860 55,788 57,041 58,495 59,930 61,428 62,992 64,539 66,035 Operatingcosts 158,319 169,114 169,027 173,658 178,204 182,606 186,143 189,768 193,130 196,719 198,635 Supportcosts - - - - - - - - - -Financecosts 18,632 28,027 33,575 40,705 45,988 51,522 57,341 59,645 60,567 61,078 60,170 Depreciationandamortisation 55,241 66,883 77,325 86,881 101,470 112,944 122,980 136,103 142,600 150,893 166,551 Totalexpenditure 277,563 316,628 334,787 357,032 382,703 405,567 426,394 446,944 459,289 473,229 491,391 SURPLUS/(DEFICIT)BEFORETAX 19,267 41,118 73,187 45,926 48,724 57,428 63,693 73,394 81,385 88,499 106,960 Taxexpense - - - - - - - - - -SURPLUS/(DEFICIT)AFTERTAX 19,267 41,118 73,187 45,926 48,724 57,428 63,693 73,394 81,385 88,499 106,960 OTHERCOMPREHENSIVEINCOME Gain/(loss)onrevaluationof financialinstruments - - - - - - - - - -Gains/Lossesonassetrevaluation 169,355 - - 113,953 - - 143,781 - - 168,299TotalOtherComprehensiveIncome 169,355 - - 113,953 - - 143,781 - - 168,299TOTALCOMPREHENSIVEINCOME 188,622 41,118 73,187 159,879 48,724 57,428 207,474 73,394 81,385 256,798 106,960 PROSPECTIVESTATEMENTOFCHANGESINNETEQUITY Fortheyearending30June Forecast Draftbudget Forecast Forecast Forecast Forecast Forecast Forecast Forecast Forecast Forecast 2024 2025 2026 2027 2028 2029 2030 2031 2032 2033 2034 $000 $000 $000 $000 $000 $000 $000 $000 $000 $000 $000 Equityatbeginningoftheyear 1,604,778 1,793,400 1,834,518 1,907,705 2,067,584 2,116,308 2,173,736 2,381,210 2,454,604 2,535,989 2,792,787 TotalComprehensiveIncome 188,622 41,118 73,187 159,879 48,724 57,428 207,474 73,394 81,385 256,798 106,960 EQUITYATENDOFTHEYEAR 1,793,400 1,834,518 1,907,705 2,067,584 2,116,308 2,173,736 2,381,210 2,454,604 2,535,989 2,792,787 2,899,747 Representedby: AccumulatedFunds Openingbalance 711,919 729,280 774,421 848,703 893,655 943,119 1,002,424 1,062,677 1,132,460 1,210,060 1,294,647 Interestallocatedtoreserves (806) (727) (705) (724) (710) (673) (740) (811) (885) (962) (1,041) Othertransferstoreserves (2,500) (3,000) (3,000) (3,000) (3,000) (3,000) (3,000) (3,000) (3,000) (3,000) (3,000) Transfersfromreserves 1,400 7,750 4,800 2,750 4,450 5,550 300 200 100 50Netsurplus/(deficit)aftertax 19,267 41,118 73,187 45,926 48,724 57,428 63,693 73,394 81,385 88,499 106,960 Closingbalance 729,280 774,421 848,703 893,655 943,119 1,002,424 1,062,677 1,132,460 1,210,060 1,294,647 1,397,566 CouncilCreatedReserves Openingbalance 39,135 41,040 37,016 35,920 36,893 36,152 34,274 37,713 41,323 45,107 49,018 Transferstoaccumulatedfunds (1,400) (7,750) (4,800) (2,750) (4,450) (5,550) (300) (200) (100) (50)Transfersfromaccumulatedfunds 2,500 3,000 3,000 3,000 3,000 3,000 3,000 3,000 3,000 3,000 3,000 Interestearned 805 726 704 723 709 672 739 810 884 961 1,040 Closingbalance 41,040 37,016 35,920 36,893 36,152 34,274 37,713 41,323 45,107 49,018 53,058 RestrictedReserves Openingbalance 64 65 66 67 68 69 70 71 72 73 74 Transferstoaccumulatedfunds - - - - - - - - - -Transfersfromaccumulatedfunds - - - - - - - - - -Interestearned 1 1 1 1 1 1 1 1 1 1 1 Closingbalance 65 66 67 68 69 70 71 72 73 74 75 AssetRevaluationReserves Openingbalance 853,660 1,023,015 1,023,015 1,023,015 1,136,968 1,136,968 1,136,968 1,280,749 1,280,749 1,280,749 1,449,048 Changesinassetvalue - - - - - - - - - -Valuationgains(losses)takentoequity 169,355 - - 113,953 - - 143,781 - - 168,299Closingbalance 1,023,015 1,023,015 1,023,015 1,136,968 1,136,968 1,136,968 1,280,749 1,280,749 1,280,749 1,449,048 1,449,048 TOTALEQUITY 1,793,400 1,834,518 1,907,705 2,067,584 2,116,308 2,173,736 2,381,210 2,454,604 2,535,989 2,792,787 2,899,747
251 | Page PROSPECTIVESTATEMENTOFFINANCIALPOSITION Asat30June Forecast Draftbudget Forecast Forecast Forecast Forecast Forecast Forecast Forecast Forecast Forecast 2024 2025 2026 2027 2028 2029 2030 2031 2032 2033 2034 $000 $000 $000 $000 $000 $000 $000 $000 $000 $000 $000 CURRENTASSETS Cashandcashequivalents 18,132 14,709 21,511 20,115 18,938 24,009 22,502 22,301 23,390 24,166 24,075 Debtorsandotherreceivables 21,264 21,264 21,732 22,242 22,752 23,263 23,752 24,220 24,709 25,177 25,644 Derivativefinancialinstruments - - - - - - - - - -Non-currentassetsheldforsale 1,524 1,303 6,454 6,192 6,385 507 1,088 494 533 548 1,175 Inventories 2,981 2,981 2,981 2,981 2,981 2,981 2,981 2,981 2,981 2,981 2,981 Prepayments 5,639 5,639 5,639 5,639 5,639 5,639 5,639 5,639 5,639 5,639 5,639 Accruedinterest 266 266 266 266 266 266 266 266 266 266 266 Otherfinancialassets - - - - - - - - - -Totalcurrentassets 49,806 46,162 58,583 57,435 56,961 56,665 56,228 55,901 57,518 58,777 59,780 NON-CURRENTASSETS Property,plantandequipment 2,014,830 2,173,584 2,279,063 2,610,502 2,773,262 2,875,620 3,190,359 3,295,477 3,365,971 3,590,423 3,664,760 Assetsunderconstruction 233,288 209,494 327,882 278,292 229,614 308,726 258,282 234,234 244,209 246,302 226,813 Intangibleassets 4,610 1,495 484 162 322 355 425 393 416 290 430 Derivativefinancialinstruments 5,609 5,609 5,609 5,609 5,609 5,609 5,609 5,609 5,609 5,609 5,609 Investmentinsubsidiaries 964 964 964 964 964 964 964 964 964 964 964 Investmentinassociates 200 200 200 200 200 200 200 200 200 200 200 InvestmentinCCOsandsimilarentities 85,697 76,497 77,197 79,247 80,397 81,197 81,097 79,997 78,897 77,797 76,397 Otherfinancialassets 455 455 455 455 455 455 455 455 455 455 455 Totalnon-currentassets 2,345,653 2,468,298 2,691,854 2,975,431 3,090,823 3,273,126 3,537,391 3,617,329 3,696,721 3,922,040 3,975,628 Totalassets 2,395,459 2,514,460 2,750,437 3,032,866 3,147,784 3,329,791 3,593,619 3,673,230 3,754,239 3,980,817 4,035,408 CURRENTLIABILITIES Cashandcashequivalents - - - - - - - - - -Borrowings-current 55,156 63,424 79,386 92,420 100,071 113,192 120,332 122,412 123,812 122,379 118,957 Derivativefinancialinstruments - - - - - - - - - -Creditorsandotherpayables 29,700 26,306 33,133 31,766 30,616 35,715 34,234 34,059 35,175 35,977 35,910 Employeeentitlements 5,206 5,206 5,321 5,445 5,570 5,695 5,815 5,930 6,049 6,164 6,278 Otherliabilities 6,506 6,506 6,649 6,805 6,961 7,118 7,267 7,410 7,560 7,703 7,846 Totalcurrentliabilities 96,568 101,442 124,489 136,436 143,218 161,720 167,648 169,811 172,596 172,223 168,991 NON-CURRENTLIABILITIES Borrowings-noncurrent 496,404 569,442 709,000 819,402 878,612 984,488 1,034,720 1,038,590 1,035,236 1,005,205 955,882 Employeeentitlements 401 372 380 389 398 407 416 424 432 440 449 Derivativefinancialinstruments 663 663 663 663 663 663 663 663 663 663 663 Provisions 8,023 8,023 8,200 8,392 8,585 8,777 8,962 9,138 9,323 9,499 9,676 Totalnon-currentliabilities 505,491 578,500 718,243 828,846 888,258 994,335 1,044,761 1,048,815 1,045,654 1,015,807 966,670 Totalliabilities 602,059 679,942 842,732 965,282 1,031,476 1,156,055 1,212,409 1,218,626 1,218,250 1,188,030 1,135,661 NETASSETS 1,793,400 1,834,518 1,907,705 2,067,584 2,116,308 2,173,736 2,381,210 2,454,604 2,535,989 2,792,787 2,899,747 Representedby: EQUITY Accumulatedfunds 729,280 774,421 848,703 893,655 943,119 1,002,424 1,062,677 1,132,460 1,210,060 1,294,647 1,397,566 Restrictedreserves 65 66 67 68 69 70 71 72 73 74 75 Councilcreatedreserves 41,040 37,016 35,920 36,893 36,152 34,274 37,713 41,323 45,107 49,018 53,058 Revaluationreserves 1,023,015 1,023,015 1,023,015 1,136,968 1,136,968 1,136,968 1,280,749 1,280,749 1,280,749 1,449,048 1,449,048 TOTALEQUITY 1,793,400 1,834,518 1,907,705 2,067,584 2,116,308 2,173,736 2,381,210 2,454,604 2,535,989 2,792,787 2,899,747
252 | Page PROSPECTIVESTATEMENTOFCASHFLOWS Fortheyearending30June Forecast Draftbudget Forecast Forecast Forecast Forecast Forecast Forecast Forecast Forecast Forecast 2024 2025 2026 2027 2028 2029 2030 2031 2032 2033 2034 $000 $000 $000 $000 $000 $000 $000 $000 $000 $000 $000 CASHFLOWSFROMOPERATINGACTIVITIES Cashwasprovidedfrom: Receiptsfromratesandlevies-Council 155,612 183,622 207,309 234,882 264,007 295,424 330,579 357,356 386,302 417,592 451,417 Userchargesandotherincome 150,036 168,784 196,096 163,389 162,652 162,710 154,564 157,987 149,277 138,962 141,658 Interestreceived 3,238 4,200 2,939 2,988 3,041 3,106 3,184 3,231 3,283 3,358 3,435 Dividendsreceived 204 204 208 213 218 223 228 232 237 241 246 Receiptsfromratesandlevies-GWRC 40,225 40,225 41,110 42,075 43,041 44,006 44,931 45,816 46,741 47,626 48,511 NetGSTreceivedfromInlandRevenue - - - - - - - - - -349,315 397,035 447,662 443,547 472,959 505,469 533,486 564,622 585,840 607,779 645,267 Cashwasappliedto: Paymentstoemployees (46,073) (52,633) (54,967) (55,903) (57,157) (58,611) (60,041) (61,535) (63,103) (64,646) (66,140) Paymentstosuppliers (173,921) (172,508) (161,650) (174,429) (178,755) (176,908) (187,050) (189,394) (191,441) (195,368) (198,154) Interestpaid (18,632) (28,027) (33,575) (40,705) (45,988) (51,522) (57,341) (59,645) (60,567) (61,078) (60,170) RatesandleviespassedtoGWRC (40,225) (40,225) (41,110) (42,075) (43,041) (44,006) (44,931) (45,816) (46,741) (47,626) (48,511) NetGSTpaidtoInlandRevenue - - - - - - - - - -(278,851) (293,393) (291,302) (313,112) (324,941) (331,047) (349,363) (356,390) (361,852) (368,718) (372,975) Netcashinflowsfromoperatingactivities 70,464 103,642 156,360 130,435 148,018 174,422 184,123 208,232 223,988 239,061 272,292 CASHFLOWSFROMINVESTINGACTIVITIES Cashwasprovidedfrom: Saleofproperty,plantandequipment 436 1,524 1,303 6,454 6,192 6,385 507 1,088 494 533 548 Otherinvestmentreceipts 11,050 - - - - - 100 1,100 1,100 1,100 1,400 11,486 1,524 1,303 6,454 6,192 6,385 607 2,188 1,594 1,633 1,948 Cashwasappliedto: Purchaseofproperty,plantandequipment (228,321) (209,120) (327,765) (278,235) (228,704) (307,864) (257,221) (233,349) (243,217) (245,751) (225,671) LessUHCCcapitalcontribution 7,958 10,399 22,201 18,621 8,516 14,793 14,673 17,663 21,670 37,848 5,227 Purchaseofassetsunderconstruction - - - - - - - - - -Purchaseofintangibleassets (4,967) (374) (117) (57) (910) (862) (1,061) (885) (992) (551) (1,142) Otherinvestmentsandpayments (23,700) 9,200 (700) (2,050) (1,150) (800) - - - -(249,030) (189,895) (306,381) (261,721) (222,248) (294,733) (243,609) (216,571) (222,539) (208,454) (221,586) Netcashoutflowsfrominvestingactivities (237,544) (188,371) (305,078) (255,267) (216,056) (288,348) (243,002) (214,383) (220,945) (206,821) (219,638) CASHFLOWSFROMFINANCINGACTIVITIES Cashwasprovidedfrom: 32% 13% 20% 14% 7% 11% 5% 1% 0% -3% -5% Proceedsfromborrowing 212,646 136,462 218,944 202,822 159,281 219,068 170,564 126,282 120,458 92,348 69,634 212,646 136,462 218,944 202,822 159,281 219,068 170,564 126,282 120,458 92,348 69,634 Cashwasappliedto: Repaymentofborrowing (37,657) (55,156) (63,424) (79,386) (92,420) (100,071) (113,192) (120,332) (122,412) (123,812) (122,379) (37,657) (55,156) (63,424) (79,386) (92,420) (100,071) (113,192) (120,332) (122,412) (123,812) (122,379) Netcashinflows/(outflows)from financingactivities 174,989 81,306 155,520 123,436 66,861 118,997 57,372 5,950 (1,954) (31,464) (52,745) Netincrease/(decrease)incash,cash equivalentsandbankoverdraft 7,909 (3,423) 6,802 (1,396) (1,177) 5,071 (1,507) (201) 1,089 776 (91) Cash,cashequivalentsandbank overdraftatbeginningoftheyear 10,223 18,132 14,709 21,511 20,115 18,938 24,009 22,502 22,301 23,390 24,166 Cash,cashequivalentsandbank overdraftatendoftheyear 18,132 14,709 21,511 20,115 18,938 24,009 22,502 22,301 23,390 24,166 24,075 Cashbalanceatendoftheyearcomprises: Cashandoncalldeposits 18,132 14,709 21,511 20,115 18,938 24,009 22,502 22,301 23,390 24,166 24,075 Shorttermdeposits - - - - - - - - - -Bankoverdraft - - - - - - - - - -Cash,cashequivalentsandbank overdraftatendoftheyear 18,132 14,709 21,511 20,115 18,938 24,009 22,502 22,301 23,390 24,166 24,075
Notes to the financial statements
Reportingentity
Hutt City Council isa territoriallocal authority establishedunderthe Local Government Act 2002 (LGA) and is domiciled andoperates in NewZealand. Council was first formed as Lower Hutt City Council on 1November 1989 by theamalgamation of five localauthorities. Thename waschangedto the Hutt City Council by a special Act of Parliament on 8 October 1991. The relevant legislation governingtheCouncil’soperationsincludedthe LGA and the Local Government (Rating)Act 2002.
The group consistsof theultimate parent,Hutt City Council, anditssubsidiaries/councilcontrolledorganisations (CCOs),Seaview MarinaLtd and Urban Plus Ltd Group (both 100 per cent owned). The Urban Plus Ltd Group consistsof Urban Plus Ltd andits100 per cent ownedsubsidiaries UPL Development Ltd andUPL Ltd Partnership. Council’s 17 per cent equity share ofitsassociate Wellington WaterLtd is equity accounted. Council’s subsidiaries/CCOs are incorporated and domiciledin NewZealand.
Councilandthegroup providelocal infrastructureand local public servicesand perform regulatory functionsto the community. Council does not operateto makea financial return. Accordingly, Councilhas designated itself and the group aspublic benefit entities (PBEs) forfinancialreportingpurposes.
The financial statementspresentedare for Councilonly anddo not include group information.
Basisofpreparation
Statementofcompliance
The draft financial statementshave been prepared in accordancewith therequirements of the LGA andthe Local Government (FinancialReportingand Prudence) Regulations 2014, which includes the requirement to comply with generally accepted accounting practice in New Zealand.
The draft financial statementshave also been prepared in accordance with Tier1 PBE accounting standards and comply with those standards.
The draft prospective financial statementswere authorised forissue by Councilon TBC. Council,that authorise the issueof the prospectivefinancial statements,are responsible for the prospective financial statementspresented,including the appropriateness ofthe assumptionsunderlyingthe prospective financial statements and allother required disclosures. No actual resultshave been incorporated in these prospective financial statements. Councildoesnot intendto updatetheprospective financial statements subsequent to presentation.
Measurementbase
The draft financial statementshave been prepared on ahistoricalcost basis, modified by the revaluation of landand buildings, certain infrastructural assets and financial instruments (including derivative instruments), which have been measured at fair value. Management isnot aware ofany material uncertaintiesthat may cast significant doubt on Council’s ability to continue asa going concern.Thedraft financial statementshave
253 | Page
therefore been prepared on a goingconcern basis,and the accounting policieshave been applied consistently throughout the period.
Presentationcurrencyandrounding
The draft financial statements are presented in New Zealand dollars, andall values are roundedto thenearest thousand dollars($000). The functionalcurrency of Councilis New Zealand dollars.
Summary of significant accounting policies
Revenue
Revenue is recognised to the extent that it is probable that the economic benefits or service potential will flow to Council and the revenue can be reliably measured, regardless of when payment is being made.
Revenue is measured at the fair value of consideration received or receivable, taking into account contractually defined terms of payment and excluding taxes or duty. The specific recognition criteria described must also be met before revenue is recognised.
Interest
Interest income is recognised using the effective interest method.
Dividends
Revenue is recognised when Council’s right to receive the payment is established, which is generally when shareholders approve the dividend.
Rental revenue
Rental revenue arising from operating leases or rental agreements on properties is accounted for on a straight-line basis over the lease or rental term and is included in revenue in the Statement of Comprehensive Revenue and Expense.
General and targeted rates revenue
General rates, targeted rates (excluding water-by-meter) are recognised at the start of the financial year to which the rates resolution relates. They are recognised as the amounts due. Council considers that the effect of payment of rates by instalments is not sufficient to require discounting of rates receivable and subsequent recognition of interest revenue.
Rates arising from late payment penalties are recognised as revenue when rates become overdue.
Revenue from water-by-meter (charged on usage) is not considered to be a rate in terms of this policy.
Rates remissions are recognised as a reduction of rates revenue when the Council has received an application that satisfies its Rates Remission Policy.
Rates collected on behalf of the Greater Wellington Regional Council (GWRC) are not recognised in the financial statements, as in this case the Council is acting as an agent for the GWRC.
Governmentgrants, subsidies and funding subsidies
Council receives government subsidy from the NZ Transport Agency - Waka Kotahi, which subsidises part of the costs of maintenance and capital expenditure on local roading infrastructure. The subsidies are recognised as revenue upon entitlement, as conditions pertaining to eligible expenditure have been fulfilled.
Other grants received
254 | Page
Council receives grants and subsidies from other organisations. Other grants are recognised as revenue when they become receivable unless there is an obligation in substance to return the funds if conditions of the grant are not met. If there is such an obligation, the grants are initially recorded as grants received in advance and recognised as revenue when the conditions of the grant are satisfied.
Infringement fees and fines
Council recognises revenue from fines (such as traffic and parking infringements) when the notice of infringement or breach is served by Council. The fair value of this revenue is determined based on the probability of collecting fines, which is estimated by considering the history of fines over the preceding two-year period.
Development andfinancial contributions
Development and financial contributions are recognised as revenue when Council provides, or can provide, the service for which the contribution was charged. Otherwise, development and financial contributions are recognised as liabilities until such time as Council provides, can to provide, the service for which the contribution was levied.
Vested assets
Where a physical asset is acquired for nil or nominal consideration, the fair value of the asset received is recognised as revenue when control over the asset is obtained. The fair value of vested or donated assets is usually determined by reference to the cost of constructing the asset. For assets received from property development, the fair value is based on construction price information provided by the property developer.
Borrowing costs
Borrowing/finance costs are recognised as an expense in the period in which they are incurred. Borrowing costs consist of interest and other costs that Council incurs in connection with the borrowing of funds. Council has chosen not to capitalise borrowing costs directly attributable to the acquisition, construction or production of assets.
Income tax
Income tax expense includes components relating to both current tax and deferred tax.
Current tax is the amount of income tax payable based on the taxable profit for the current year, plus any adjustment to income tax payable in respect of prior years. Current tax is calculated using tax rates (and tax laws) that have been enacted or substantively enacted at balance date.
Deferred tax is the amount of income tax payable or recoverable in future periods in respect of temporary differences and unused tax losses. Temporary differences are differences between the carrying amount of assets and liabilities in the Statement of Financial Position and the corresponding tax bases used in the computation of taxable surplus.
Deferred tax is measured at the tax rates that are expected to apply when the asset is realised or the liability is settled, based on tax rates (and tax laws) that have been enacted or substantively enacted at balance date. The measurement of deferred tax reflects the tax consequences that would follow from the way the entity expects to recover or settle the carrying amount of its assets and liabilities.
255 | Page
Deferred tax liabilities are generally recognised for all taxable temporary differences.
Deferred tax assets are recognised to the extent that it is probable that taxable surplus will be available against which the deductible temporary differences or tax losses can be utilised.
Deferred tax is not recognised if the temporary difference arises from the initial recognition of goodwill or from the initial recognition of an asset and liability in a transaction that is not a business combination and, at the time of the transaction, affects neither accounting surplus nor taxable surplus.
Current tax and deferred tax are recognised against the surplus or deficit for the period, except when it relates to a business combination, or to transactions recognised in other comprehensive revenue and expenses or directly in equity.
Cash and cash equivalents
Cash and cash equivalents (current assets) in the Statement of Financial Position comprise cash at bank, cash in hand, deposits held at call with banks and other shortterm highly liquid investments with original maturities of three months or less that are readily convertible to known amounts of cash and subject to an insignificant risk of changes in value.
For the purposes of the Statement of Cash Flows, cash and cash equivalents consist of cash and cash equivalents, as defined above, net of outstanding bank overdrafts. Bank overdrafts are shown within interest-bearing loans and borrowings in current liabilities in the Statement of Financial Position.
Debtors and otherreceivables
Debtors and other receivables are initially measured at their face value, less an allowance for expected credit losses. A receivable is uncollectable when there is evidence that the amount due will not be fully collected. The amount that is uncollectable is the difference between the amount due and the present value of the amount expected to be collected.
Derivative financial instruments
Council uses derivative financial instruments such as interest-rate swaps to manage exposure to interest-rate risks arising from Council’s operational and financing activities. Council does not hold or issue derivative financial instruments for trading purposes.
Derivatives are initially recognised at fair value on the date a derivative contract is entered into and are subsequently measured at their fair value at each balance date. As Council does not designate its derivative financial instruments as hedging instruments for accounting purposes, the associated gains or losses on derivatives are recognised within surplus or deficit.
Derivatives are carried as current or non-current assets when their fair value is positive and as current or non-current liabilities when their fair value is negative, depending on the maturity of the instrument.
Property, plant andequipment
Property, plant and equipment consist of:
Operational assets
256 | Page
These include land, buildings, landfill post-closure, improvements, library books, plant and equipment, collection items and motor vehicles.
Restricted assets
Restricted assets are mainly parks and reserves owned by Council that provide a benefit or service to the community and cannot be disposed of because of legal or other restrictions.
Infrastructure assets
Infrastructure assets are fixed-utility systems owned by Council. Each asset class (roading assets, water assets, stormwater assets and wastewater assets) includes all items that are required for the network to function. For example, sewerage reticulation includes reticulation piping and sewer pump stations.
Land (operational and restricted, except land under roads) and art collections are measured at fair value. Buildings and infrastructure assets are measured at fair value less accumulated depreciation. All other asset classes are measured at cost less accumulated depreciation and impairment losses.
Measurement subsequent to initial recognition – revaluation
Land (excluding land under roads), buildings and infrastructural assets are revalued with sufficient regularity to ensure their carrying amount does not differentiate materially from fair value, at least every three years.
The carrying values of revalued assets are assessed annually to ensure that they do not differ materially from the assets’ fair values. If there is a material difference, then the off-cycle asset classes are revalued.
Revaluation of property, plant and equipment is accounted for on a class-by-class basis.
The net revaluation results are credited or debited to other comprehensive revenue and expense and are accumulated to an asset revaluation reserve in equity for that class of asset. Where this would result in a debit balance in the asset revaluation reserve, this balance is not recognised in other comprehensive revenue and expense but is recognised in the surplus or deficit. Any subsequent increase on revaluation that reverses a previous decrease in value recognised in the surplus or deficit will be recognised first in the surplus or deficit up to the amount previously expensed, and then recognised in other comprehensive revenue and expense.
The fair value of land, buildings, site improvements and collection assets are their market value. The fair value of the roading, water assets, stormwater assets and wastewater assets are measured using the depreciated replacement cost. Fair value is assessed by an independent registered valuer.
Additions
The cost of an item of property, plant and equipment is recognised as an asset if, and only if, it is probable that future economic benefits or service potential associated with the item will flow to Council and the cost of the item can be measured reliably. Work in progress is recognised at cost less impairment and is not depreciated.
257 | Page
In most instances, an item of property, plant and equipment is initially recognised at its cost. Where an asset is acquired through non-exchange transactions, it is recognised at its fair value as at the date of acquisition.
Disposals
An item of property, plant and equipment is de-recognised upon disposal or when no further future economic benefits or service potential are expected from its use or disposal. Gains and losses on disposals are determined by comparing the proceeds with the carrying amount of the asset. Gains and losses on disposals are reported net in the surplus or deficit. When revalued assets are sold, the amounts included in asset revaluation reserves in respect of those assets are transferred to accumulated funds.
Subsequent costs
Costs incurred subsequent to initial acquisition are capitalised only when it is probable that future economic benefits or service potential associated with the item will flow to Council and the cost of the item can be measured reliably. The costs of day-to-day servicing of property, plant and equipment are recognised in the surplus or deficit as they are incurred.
Depreciation
Depreciation is provided on a straight-line basis on all property, plant and equipment (other than land, land under roads and art collections), at rates calculated to allocate the cost or valuation of the asset less any estimated residual value over its remaining useful life. The useful lives and associated depreciation rates of major classes of assets have been estimated as follows:
258 | Page
Years Percentages Operational assets Site improvements 2 – 40 2.50 – 50.00 Buildings 3 – 80 1.25 – 33.33 Landfill assets (including plant and infrastructure not associated with the network) 3 – 70 1.43 – 33.33 Library books 7 14.28 Plant and equipment 1 – 30 33.33 – 100.00 Vehicles 3 – 5 20.00 – 33.00 Wharves 5 – 56 1.77 – 19.03 Breakwaters 88 1.14 Infrastructure assets Stormwater, supply and wastewater utility assets
The residual value and useful life of an asset is reviewed, and adjusted if applicable, at each financial year end.
In respect of revalued assets, the useful life is adjusted to a rate recommended by the independent valuer as at the date of the revaluation.
Upper Hutt City Council’s interestin the bulk wastewater system
The Hutt Valley and Wainuiomata bulk wastewater system is managed by Council.
Upper Hutt City Council pays an annual levy to Hutt City Council based on an apportionment formula equating to between 29 per cent and 33 per cent of the funding requirements. While Upper Hutt City Council does not have legal ownership of the bulk wastewater system, it is entitled to a share of the proceeds from any sale of the assets.
Upper Hutt City Council’s interest in the bulk wastewater system assets is deducted from the value of property, plant and equipment recognised in the Statement of Financial Position. Funding contributions from Upper Hutt City Council are recognised as revenue in the surplus or deficit if the contributions are for the operation of the bulk wastewater system. Funding contributions for capital work are recognised as an increase in Upper Hutt City Council’s interest in the bulk wastewater system assets.
Intangible assets
Software acquisition and development
Acquired computer software licences are capitalised on the basis of the costs incurred to acquire and bring to use the specific software. Costs that are directly associated with the development of software for internal use by Council are recognised as an intangible asset.
Direct costs include the software development employee costs and an appropriate portion of relevant overheads.
Staff training costs, costs associated with maintaining computer software and costs associated with development and maintenance of Council’s website are recognised as an expense when incurred.
259 | Page Years Percentages Stormwater assets 10 – 57 1.76 – 9.28 Water supply assets 3 – 36 2.79 – 33.3 Wastewater assets (including treatment plant) 2 – 155 0.65 – 50 Roading network 0 – 33.67 Over 3 years Seawalls 58 1.70
Resource consents
Costs associated with registering a resource consent in the wastewater activity are recognised as an intangible asset.
Amortisation
The carrying value of an intangible asset with a finite life is amortised on a straightline basis over its useful life. Amortisation begins when the asset is available for use and ceases at the date that the asset is de-recognised. The amortisation charge for each period is recognised in the surplus or deficit.
The useful lives and associated amortisation rates of major classes of intangible assets have been estimated as follows:
Computer software
Resource consents
2–10 years 10.00% – 52.55%
12–29 years 3.33% – 7.86% (life of the consent)
Impairment of property, plant, equipment and intangible assets
Intangible assets subsequently measured at cost that have an indefinite useful life, or are not yet available for use, are not subject to amortisation and are tested annually for impairment.
Property, plant, equipment and intangible assets subsequently measured at cost that have a finite useful life are reviewed for indicators of impairment whenever events or changes in circumstances indicate the carrying amount may not be recoverable. An impairment loss is recognised for the amount by which the asset’s carrying amount exceeds its recoverable amount. The recoverable amount is the higher of an asset’s fair value less costs to sell and value in use.
If an asset’s carrying amount exceeds its recoverable amount, the asset is regarded as impaired and the carrying amount is written down to the recoverable amount. The total impairment loss is recognised in the surplus or deficit. The reversal of an impairment loss is recognised in the surplus or deficit.
Creditors andother payables
Short-term creditors and other payables are recorded at face value.
Borrowings
Borrowings are initially recognised at their face value plus transaction costs. After initial recognition, all borrowings are measured at amortised costs using the effective interest rate.
Borrowings are classified as current liabilities, unless Council has an unconditional right to defer settlement of the liability for at least 12 months after the balance date.
Employee entitlements
Short-term benefits
Employee benefits that Council expects to be settled wholly before 12 months after the end of the period in which the employee renders the related service are measured on accrued entitlements at current rates of pay. These include salaries and wages accrued up to balance date, annual leave earned to, but not yet taken at, balance
260 | Page
date, and retiring and long-service leave entitlements expected to be settled wholly before 12 months.
Council recognises a liability and an expense for bonuses where contractually obliged or where there is a past practice that has created a constructive obligation.
Long-term benefits
Employee benefits due to be settled beyond 12 months after the end of the period in which the employee renders the related service include retirement gratuities. Due to the low value of the benefit and the fact that most employees who are entitled to this benefit have now accrued full entitlements, no actuarial valuation has been undertaken. The calculation is based on the entitlements accruing for eligible staff based on years of service using current remuneration rates.
Presentation of employee entitlements
Annual leave and vested long service leave are classified as a current liability. All other employee entitlements are classified as a non-current liability, as retirement dates are not known.
Superannuation schemes
Defined contribution schemes
Obligations for contributions to KiwiSaver and defined contribution superannuation schemes are recognised as an expense in the surplus and deficit as incurred.
Provisions
Council recognises a provision for future expenditure of uncertain amount or timing when there is a present obligation (either legal or constructive) as a result of a past event, it is probable that expenditures will be required to settle the obligation and a reliable estimate can be made of the amount of the obligation.
Provisions are measured at the present value of the expenditures expected to be required to settle the obligation using a pre-tax discount rate that reflects current market assessments of the time value of money and the risks specific to the obligation. The increase in the provision due to the passage of time is recognised as an interest expense and is included in ‘finance costs’.
Landfill post-closure costs
As operator of the Silverstream Landfill site, Council has an obligation to ensure the ongoing maintenance and monitoring services at landfill sites after closure. Council also has an obligation to monitor the closed landfill site at Wainuiomata and other sites previously operated by local authorities subsequently amalgamated to form Hutt City Council.
A site restoration and aftercare provision has been recognised as a liability in the Statement of Financial Position. Provision is made for the present value of closure and post-closure costs when the obligation for post-closure arises. The calculated cost is based on estimates of closure costs and future site trade waste charges and monitoring costs. The estimated length of time needed for post-closure care is 25 years.
261 | Page
The calculations assume no change in the legislative requirements or technological changes for closure and post-closure treatment. The discount rate used is a pre-tax rate that reflects current market assessments of the time value of money and the risks specific to Council.
Amounts provided for closure and post-closure costs are capitalised to the landfill asset where they give rise to future economic benefits, or if they are incurred to enable future economic benefits to be obtained. The capitalised landfill asset is depreciated over the life of the landfill based on the capacity used. The provision of landfill post-closure costs is valued annually by an independent valuer.
Equity
Equity is the community’s interest in Council and is measured as the difference between total assets less total liabilities. Equity is disaggregated and classified into the following components:
• accumulated funds (comprehensive revenue and expenses)
• council-created reserves
• restricted reserves
• asset revaluation reserves.
Accumulated comprehensive revenue and expense is Council’s accumulated surplus or deficit since the formation of Council, adjusted for transfers to/from specific reserves.
Reserves represent a particular use to which various parts of equity have been assigned. Reserves may be legally restricted or created by Council.
Council-created reserves are established by Council. They may be altered without reference to any third party or the courts. Transfers to and from these reserves are at the discretion of Council.
Restricted reserves are subject to specific conditions accepted as binding by Council, which may not be revised by Council without reference to the courts or a third party. Transfers from these reserves may be made only for specified purposes or when certain conditions are met.
Asset revaluation reserves relate to the revaluation of property, plant and equipment to fair value after initial recognition.
Goods and services tax (GST)
All items in the financial statements are stated exclusive of GST, except for receivables and payables, which are stated on a GST-inclusive basis. Where GST is not recoverable as input tax it is recognised as part of the related asset or expense. The net amount of GST recoverable from, or payable to, the Inland Revenue Department (IRD) is included as part of receivables or payables in the Statement of Financial Position.
The net GST paid to or received from the IRD, including the GST relating to investing and financing activities, is classified as an operating cash flow in the Statement of Cash Flows.
262 | Page
Operating statements included in the Statement of Service Performance
The operating statements report the net cost of services for significant activities of Council. Council has derived the net cost of services for each significant activity using the cost allocation system outlined below.
Direct costs are charged directly to significant activities. Indirect costs are charged to the significant activities based on cost drivers and related activity or usage information.
Each significant activity has been charged an internal interest cost. The net interest cost incurred by Council is allocated to each significant activity based on the net book value of property, plant and equipment used by the activity.
Critical accountingestimates and assumptions
In preparing these financial statements, Council management has made estimates and assumptions concerning the future that affect the reported amount of revenues, expenses, assets and liabilities, and the accompanying disclosures. These estimates and assumptions may differ from the subsequent actual results. Estimates are continually evaluated and are based on historical experience and other factors, including expectations or future events that are believed to be reasonable under the circumstances. The estimates and assumptions that have a significant risk of causing a material adjustment to the carrying amounts of assets and liabilities within future financial years are discussed below.
Infrastructural assets
There are a number of assumptions and estimates used when performing depreciated replacement cost valuations over infrastructural assets. These include:
• The physical deterioration and condition of an asset: for example, Council could be carrying an asset at an amount that does not reflect its actual condition. This is particularly so for those assets that are not visible; for example, stormwater, wastewater and water supply pipes that are underground. This risk is minimised by Council performing a combination of physical inspections and condition modelling assessments of underground assets
• Estimating any obsolescence or surplus capacity of an asset
• Determining the remaining useful lives over which the asset will be depreciated. These estimates can be impacted by the local conditions, for example, weather patterns and traffic growth. If useful lives do not reflect the actual consumption of the benefits of the asset, then Council could be over- or under-estimating the annual depreciation charge recognised as an expense in the Statement of Comprehensive Income. To minimise this risk Council’s infrastructural asset useful lives have been determined with reference to the New Zealand Infrastructural Asset Valuation and Depreciation Guidelines published by the National Asset Management Steering Group and have been adjusted for local conditions based on past experience. Asset inspections, and deterioration and condition modelling, are also carried out regularly as part of the Council’s asset management planning activities, which gives Council further assurance over its useful life estimates.
263 | Page
Experienced independent valuers perform Council’s infrastructural asset revaluations.
Provision for landfill aftercare costs
The long-term nature of the liability means that there are inherent uncertainties in estimating costs that will be incurred. The future cash outflows for the provision have been estimated taking into account existing technology and known changes to legal requirements.
Provisions are measured at management’s best estimate of the expenditures required to settle the obligation at the reporting date and are discounted to present value where the effect is material.
In determining the fair value of the provision, assumptions and estimates are made in relation to the discount rate, the expected cost of the post-closure restoration and monitoring of the landfill site and the expected timing of these costs. Expected costs and timing of the closure are based on the estimated remaining capacity of the landfill, based on the advice and judgement of qualified engineers. The estimates are discounted at a pre-tax discount rate that reflects current market assessments of the time value of money.
For other significant forecasting assumptions, see section 4.
Critical judgements in applying accounting policies
Management has exercised the following critical judgements in applying accounting policies in relation to the classification of property.
Council owns a number of properties held to provide housing to pensioners. The receipt of market-based rental from these properties is incidental to holding them. The properties are held for a service delivery objective as part of Council’s social housing policy. The properties are therefore accounted for as property, plant and equipment rather than as investment property.
264 | Page
Notes to the financial statements
Reserve funds
Reserves are held to ensure that funds received for a particular purpose are used for that purpose and any surplus created is managed in accordance with the reason for which the reserve was established. Surpluses held in reserves are credited with interest. Council holds 12 reserve funds; five are restricted reserves. Restricted reserves are reserves that have rules set by legal obligation that restrict the use that Council may put the funds towards.
The remaining Council-created reserves are discretionary reserves that Council has established for the fair and transparent use of monies. Reserves are not separately held in cash and the funds are managed as part of Council’s treasury management.
Table 1 contains a list of current reserves, outlining the purpose for holding each reserve and the Council activity to which each reserve relates, together with summary financial balances.
Council-created reserves
– purpose of the fund
Reserve purchase and development (parks and reserves activity)
To provide for the purchase of land for reserves purposes or the development of existing reserves. The fund is made up of financial contributions from subdivision and revenue from the sale of surplus reserve land. The main purpose of the fund is to provide open space and recreational opportunity to offset the effects of land use intensification.
To annually provide for the
265 | Page
Opening balance July 2025 Deposits Expenditure Closing balance June 2034 $000 $000 $000 $000
Table 1:Current reserves
27,641 35,570 (25,950) 37,261 Election fund (managing services activity)
150 - - 150
of Council elections and by-elections.
Landfills reserve (solid waste activity)
To set funds aside for the longer-term replacement of the landfill. This figure has been capped at $12M.
Waste minimisation reserve
To encourage a reduction in the amount of waste generated and disposed of in New Zealand, and to lessen the environmental harm of waste. This reserve was created in 2009 as a result of the Waste Minimisation Act 2008. Funding is distributed to local authorities by the Ministry for the Environment and expenditure includes grants to others, waste minimisation initiative operating expenses and recycling contracts.
Wingate Landfill reserve (parks and reserves activity)
To provide for the development and major maintenance of the former landfill areas (top areas) at the end of Page Grove, Wingate, now managed as
266 | Page Opening balance July 2025 Deposits Expenditure Closing balance June 2034 $000 $000 $000 $000 cost
12,000 - - 12,000
857 2,255 - 3,112
196 71 - 267
land and used for various recreational activities.
Wingate Park (parks and reserves activity)
To provide for the development and major maintenance of the former landfill areas (bottom areas) at the end of Page Grove, Wingate, now managed as reserve land and used for various recreational activities.
Ex-Hillary Commission funds (aquatics and recreation)
To provide funding for sporting activities. Approval needs to be given by Sport New Zealand.
Restricted reserves –purpose of the fund Taitā Cemetery – JV Bently (parks and reserves activity)
The Council is contracted to maintain Plot 32/33, block 7, St James section in perpetuity. The plots contain Issac Young, Eliza Young and AG Talbut.
267 | Page Opening balance July 2025 Deposits Expenditure Closing balance June 2034 $000 $000 $000 $000
reserve
189 69 - 258
7 3 - 10 Totals 41,040 37,968 (25,950) 53,058
3 0 - 3
tree bequest (parks and reserves activity)
To provide for the planting of trees in and around Hutt City on major thoroughfares.
Talbut bequest (parks and reserves activity)
To provide for the planting and maintenance of reserves.
Arts Trust (museums activity)
To purchase for the Dowse Collection works of art created by Eastbourne artists, being artists who have or have had a significant association with Eastbourne.
268 | Page Opening balance July 2025 Deposits Expenditure Closing balance June 2034 $000 $000 $000 $000 Lavelle
34 7 - 41 ML
15 2 - 17 Eastbourne
13 1 - 14 Totals 65 10 - 75
Prudence reporting
Rates (increase)Affordability Benchmark
Council meets the rates affordability benchmark if planned rates increases are equal or less than each quantified limit on rates increases.
The following graph compares Council's proposed rates increases with the quantified limit on rates increases contained in the Financial Strategy in the Long Term Plan 2024-2034. The quantified limits are set to enable the achievement of a balanced operating budget by 2028-29 (based on Council’s definition of a balanced operating budget) while maintaining debt headroom at reasonable levels.
2027-28 includes the impact of introducing the new rates funded food and green organics waste service.

Debt Affordability Benchmark(Planned debt compared to debt limits)
Council meets the debt affordability benchmark if planned borrowing is within each quantified limit on borrowing.
The following graph compares Council's actual borrowing with a quantified limit on borrowing stated in the financial strategy included in the Long Term Plan 2024-2034. The Long Term Plan 2024-2034 achieves debt levels within the quantified limit.
269

Debt Affordability Benchmark(Planned debt as percentageof revenue)
Council meets the debt affordability benchmark if planned borrowing is within each quantified limit on borrowing as a percentage of revenue (excluding development contributions, financial contributions, gains on derivative financial instruments and revaluation on PPE).
The following graph compares Council's actual borrowing with a quantified limit on borrowing stated in the Financial Strategy included in the Long Term Plan 2024-2034. The Long Term Plan 2024-2034 achieves debt levels within the quantified limit.

Balanced Budget Benchmark(Planned RevenueGreater Than Planned Expenditure)
Council meets the balance budget benchmark for each year if its revenue (excluding development contributions, financial contributions, vested assets, gains on derivative financial instruments and revaluation on property, plant or
270 | Page
equipment) exceeds its operating expenses (excluding losses on derivative financial instruments and revaluations of property, plant or equipment).
The Council meets this benchmark if its revenue equals or is greater than its operating expenses. The benchmark is met for all the years of the plan however the revenue as defined includes capital sources of funding (central government grants and subsidies) linked to specific capital programmes and projects. Should thesecapital sources of funding beremoved, thebenchmarkwould not bemet from 2024 to 2028.

Essential Services Benchmark
Council meets the essential service benchmark if its capital expenditure on network services for the year equals or is greater than depreciation on network services
The following graph displays the Council's planned capital expenditure on network services as a proportion of depreciation on network services. Council meets this benchmark as its planned capital expenditure on network services is equal to or greater than depreciation on network services.

271 | Page
Debt Servicing Benchmark
Council meets the debt servicing benchmark if its borrowing costs for the year equals or are less than 15% (10% in 2024) of its revenue (excluding development contributions, financial contributions, vested assets, gains on derivative financial instruments and revaluation of property, plant and equipment).
The following graph displays the council's planned borrowing costs as a proportion of revenue (excluding development contributions, financial contributions, vested assets, gains on derivative financial instruments, and revaluation of property, plant and equipment). Because Statistics New Zealand projects the council's population will grow as fast as the national population growth rate, it meets the debt servicing benchmark if its borrowing costs equal or are less than 15% of its revenue. Actual borrowing costs as a percentage of revenue are well within the 15% limit.

272 | Page
Funding impact statement including rates for 2024-25
Tauākīpāpātanga tāhua āpitiatu ki ngā tākekaunihera 2024-25
Funding impact statements including 2024-25 rates
Section A: Introduction
This Draft Funding Impact Statement includes full details of how rates are calculated. It should be read inconjunction with Council’sRevenue and Financing Policy(see section 4), which sets out Council’s policies inrespect of each source of funding.
Summary of funding mechanisms and indication of level of funds to be produced by each mechanism
The Whole of Council Funding Impact Statement sets out the sources of funding to be used for 2024-25 and for subsequent years, the amount of funds expected to be produced from each source, and how the funds are to be applied. Details of user charges and other funding sources, and the proportion applicable to each activity, are included in Council’s Revenue and Financing Policy which isincluded in the 10Year Plan. Charges include GST unless otherwise noted.
Uniform annual general charge
Council is proposing not to seta uniform annual general charge (UAGC) for 202425.
Potential new rates during theterm of the Long Term Plan 2024-34
Council is proposing to setand assessa new targeted rate for a Green and Organic Waste household kerbside service. Community feedback isbeing sought through the draft Long Term Plan engagement. If approved, the new targeted rate and service would take effect from from 1 July 2027.
Definition of separately used or inhabited part
For the purposes of any targeted rate set as a fixed amount per separately used or inhabited part (SUIP) of a rating unit, a SUIP isdefined as:
Any part of the rating unit separately used or inhabited by the owner or any other person who has the right to use or inhabit that part byvirtue of a tenancy, lease, licence or other agreement.
273 | Page
At a minimum, the land or premises intended to form the SUIP of the rating unit must be capable of actual habitation, or actual useby persons for purposes of conducting a business.
For the avoidance of doubt, a rating unit thathas only one use (i.e., it does not have separate parts or is vacant land)is treated asbeing one SUIP of a rating unit.
Section B: Rates for year
For 2024-25, and for subsequent years, Council will set the following rates.
a. Water supply rate
A targeted rate will be set to meet the net operating costs of water supply and reticulation in the city. Lump sums will notbe invited in respect of this rate. Council has set the targeted rate for water supply on the basis of the following factors:
• a charge per SUIP of a rating unitthat isconnected to the water reticulation system and is not metered
• a charge of 50percent of the above charge per SUIP of a rating unit that is not connected to but is able to be connected to the water reticulation system
• a charge per rating unit that is connected to the water reticulation system and contains more than one SUIP, where a water meter has been installed to measure the total water consumed provided that:
➢ rating units situated within 100m of any part ofthe water reticulation network are considered to be able to be connected (i.e., serviceable)
➢ rating units that are not connected to the system, and that are not able to be connected, will not beliable for this rate
➢ where the owner of a rating unit with more than one SUIP has installed a water meter to measure the total water consumed, the owner will be liable to pay for water consumed as measured by the meter as set out in Council’s Fees and Charges (see Appendix 1).
The proposed charges for the 2024-25 rating year are as follows:
b. Wastewater rate
A targeted rate will be set to meet the net operating costs of wastewater collection, treatment and disposal within the city. Lump sums will not be invited in respect of this rate.
274 | Page
Category Charge Connected and unmetered $746.00 per SUIP Serviceable but not connected $373.00 per SUIP Connected and metered $746.00 per rating unit
Council will set the targeted rate for the wastewater function on the basis of the following factors:
• a charge per SUIP of a rating unitfor all rating units connected to the wastewater system
• for rating units in the commercial categories, an additional charge of 50percent of the full charge for the second and each subsequent WC or urinal connected to the wastewater system from each rating unit
provided that:
• no charge is made to any rating unit not connected to the wastewater system.
The proposed charges for the 2024-25 rating year are as follows:
Category Charge
Connected – SUIP $766.00 each
For commercial rating units in the CMC, CMS, and UTNcategories - second and each subsequent WC or urinal from each rating unit $383.00 each
c. Recycling collection targeted rate
A targeted rate will be set to meet 100percent of the costs of the recycling collection service. Lump sums will not be invited inrespect of this rate.
For rating units in the Residential and Rural differential categories, the targeted rate will be set asa fixed amount per SUIP of eachserviceable rating unit.
For Community Education facility rating units (those rating units that are 100% NonRateable under schedule 1 clause 6, part 1, of the Local Government (Rating) Act) and rating units in the CF1,CF2, or CF3 differential categories, ratepayers will be able to opt in to receive the recycling service. The targeted rate will be set asa fixed amount per SUIP of each rating unit that receives this service.
Rating units in the Residential and Rural differential categories that are not able to be serviced by the system will not be liable for this rate. This could include:
• land that does not have improvements recorded
• land with a storage shed only
• land that cannot receive the service due to inaccessibility, as determined by the Council.
275 | Page
The proposed charge for the 2024-25 rating year is as follows: Category Chargeper SUIP
Rating units in the Residential and Rural categories that can be serviced; or Community Education Facilities and
Rating units in the CF1,CF2 or CF3 categories, that choose to opt in
d. Refusecollection targeted rate
$130.00
A targeted rate will be set to meet 100percent of the costs of the rubbish collection service. Lump sums will not be invited inrespect of this rate.
Rating units in the Residential and Rural differential categories that are not able to be serviced by the system will not be liable for this rate. This could include:
• land that does not have improvements recorded
• land with a storage shed only
• land that cannot receive the service due to inaccessibility, as determined by the Council.
For Community Education facility rating units (those rating units that are 100% NonRateable under schedule 1 clause 6, part 1, of the Local Government (Rating) Act) and rating units in the CF1,CF2, or CF3 differential categories, ratepayers will be able to opt in to receive the refuse collection service.
The rate is set on a differential basis, based onprovision or availability of the service.
The targeted rate will be set per SUIP based on extent of provision of service on each serviced rating unit as follows: Community Education Facility (those rating units that are 100% Non-Rateable under schedule 1 clause 6 of the Local Government (Rating) Act), CF1,CF2 and CF3 differential categories.
The targeted rate will be set per SUIP based on extent of provision of service on each rating unit able to be serviced in the Residential and Rural differential categories.
The standard refuse service includes one 120-litre bin (or equivalent). Rating units can opt to use an 80-litre or 240-litre bin instead of the standard service. Rating units in the Residential and Rural differential categories that are able to be serviced but opt not to be, will be rated atthe charge applying tothe 80-litre bin.
276 | Page
The proposed charges for the 2024-25 rating year are as follows:
e. Green wastecollection targeted rate
A targeted rate will be set to meet 100percent of the costs of the green waste collection service. Lump sums will not be invited in respect of this rate.
For Community Education facility rating units (those rating units that are 100% NonRateable under schedule 1 clause 6, part 1, of the Local Government (Rating) Act, and rating units in the CF1, CF2 ,CF3, Residentialand Rural differential categories, ratepayers will be able to opt in to receive thegreen waste service. The targeted rate will be set asa fixed amount per SUIP of each rating unit that receives this service.
The proposed charge for the 2024-25 rating year is as follows:
by those that choose to opt in
Council is proposing to setand assessa new targeted rate for a Green and Organic Waste household kerbside service. Community feedback isbeing sought through the draft Long Term Plan engagement. If approved, the new targeted rate and service would take effect from from 1 July 2027.
f. Jackson Street Programmerate
A targeted rate, based on thecapital value of each rating unit, will be set to raise revenue from rating units in the Commercial Suburban category and witha frontage to Jackson Street, Petone, between Hutt Road and Cuba Street. The revenue raised
277 | Page
Category Provision or availability Per SUIP Residential, Rural, Community Education Facility, CF1, CF2
CF3
units 80 Litre or equivalent $128.00 Residential, Rural, Community Education Facility,
CF3
units 120 Litre or equivalent $192.00 Residential, Rural, Community Education Facility, CF1, CF2
CF3 rating units 240 Litre or equivalent $384.00 Residential and Rural rating units Able to be serviced but not serviced $128.00
and
rating
CF1, CF2 and
rating
and
Category Charge per SUIP
of service
$115.00
Provision
determined
from this rate will be applied to meet the costsof the Jackson Street Programme, a community-based initiative to help reorganise and revitalise commercial activities in Jackson Street. Lump sums will not be invited in respect of this rate.
The proposed charge for the 2024-25 rating year is as follows: Category Charge
Rating units (or part thereof) in the Commercial Suburban category having frontage to Jackson Street, Petone, between Hutt Road and Cuba Street
g. General rate
A general rate will be set:
cents per $ of capital value
• to meet the costs of Council activities, other than those detailed above
• based on the capital value of each rating unitin the city
• on a differential basis, based on the use to which the land isput and its location.
Section C: Differential rating details
Each rating unit(or part thereof) is allocated to a differential rating category (based on land use and location) for the purpose of calculating the general rate and some targeted rates. Set out below are the definitions used to allocate rating units to categories, together with details of the differential rating relationships between each category of rating unit for the purposes of setting and assessing the general rate.
Definition of rating categories: Category Description
Residential (RES) All land that is: used for residential purposes, excluding land categorised as rural; or used or set aside for reserve or recreational purposes (other than East Harbour Regional Park); and not otherwise categorised in the Definition of Rating Categories table
278 | Page
0.0006413
Rural (RUR) All land located in the Rural zone in the Council’s operative District Plan, excluding land categorised as : Community Facilities; Commercial Suburban; Utility Networks.
Commercial Central (CMC)
Commercial Suburban (CMS)
All land used for commercial and/or industrialpurposes, and located within the Central Commercial Area as defined in the Council’s operative District Plan, excluding land categorised as: Community Facilities; Utility Networks.
All land used for commercial and/or industrialpurposes, excluding land categorised as:
Community Facilities; Commercial Central; Utility Networks.
Utility Networks (UTN)
Community Facilities 1 (CF1)
Community Facilities 2 (CF2)
All land comprising all or part of a utility network.
All land that is:
100% non-rateable in terms of the Local Government (Rating) Act 2002, Schedule 1, Part 1
50% non-rateable in terms of the Local Government (Rating) Act 2002, Schedule 1, Part 2.
All land occupied bycharitable trusts and not-for-profit organisations that either: use the land for non-trading purposes for the benefit of the community; or
would qualify asland thatis 50% non-rateable in accordance with Part 2 of Schedule 1 of the Local Government (Rating) Act 2002 if the organisation did not have a liquor licence.
Community Facilities 3 (CF3)
All land occupied by not-for-profit community groups or organisations whose primary purpose is to address the needs of adult members for entertainment or social interaction, and which engage in recreational, sporting, welfare or community services as a secondarypurpose
For the purposes of these definitions:
• Rating units that have no apparent land use (or where there is doubt as to the relevant use) will be placed in a category which best suits the activity area of the property under the District Plan.
• Rating units that have more than one use will be ‘divided’ so that each part may be differentially rated based on the landuse of each part.
For the avoidance of doubt, ‘commercial purposes’ includes rating units used:
• as a hotel, motel, inn, hostel or boarding house
279 | Page
• primarily as licensed premises
• as a camping ground
• as a convalescent home, nursing home, rest home or hospice operating for profit
• as a fire station
• by a government, quasi-government or localauthority agency for administration or operational purposes
• as an establishment similar to any of the kindsreferred to above, except to the extent that any such rating unit is non-rateable land in terms of the Local Government (Rating) Act 2002.
A ‘utility network’ includes:
• a gas, petroleum or geothermal energy distribution system
• an electricity distribution system
• a telecommunications or radio communications system
• a wastewater, storm water or water supply reticulation system.
•
Subject to the right of objection set out in section 29 of the Local Government (Rating) Act 2002, it shall be at the solediscretion of Council to determine the use or primary use of any rating unit in the city.
Relationships of differential categories
The general rate payable on eachcategory of property is expressed as a rate in the dollar of capital value.
The general rate will be apportioned between residential, commercial and utility categories based on a percentage applied toeach category group.
The percentage proposed to be applied to each category group for the three years from 2024-25 are agreed following the completion of step two of the section 101(3) funding needs analysis process (whichis designed to allow the Council toapply its judgement on the overall impact of the allocation of liabilityfor revenue needs on the current and future social, economic, environmental and cultural wellbeing of the community).
The indicativepercentages to be applied under the new policy are as proposed as follows (including 2023-24 asa comparator):
280 | Page
Rating category 2023-24 percentage 2024-25, 2025-26 & 2026-27 percentage Residential 60% 60% Commercial Central 8.0% 7.7%
The following table sets out the proposed differential factors that Council willapply across all differential categories in 2024-25 togive effect to the approach. The general rate differentials and charge per dollar of capital value are:
Section D: Other information
Summaryofproposedrevenuerequiredbydifferentialgroupin2024-25
281 | Page Rating category 2023-24 percentage 2024-25, 2025-26 & 2026-27 percentage Commercial Suburban 25.3% 25.4% Utility Networks 5.4% 5.6%
Category 2024-25 Differential Charge per $ of capitalvalue Residential 1.000 0.254811 cents Rural 0.747 0.190344 cents Commercial Central 3.465 0.882964 cents Commercial Suburban 2.829 0.720832 cents Utility Networks 3.406 0.867900 cents Community Facilities 1 1.000 0.254811 cents Community Facilities 2 0.500 0.127406 cents Community Facilities 3 2.344 0.597277 cents
Differential group Total rates by category 2024-25 $000 GSTinclusive Proportion of total rates Residential 157,813 72.1% Rural 1,279 0.6% Utility Networks 7,609 3.5% Commercial Central 11,116 5.1% Commercial Suburban 38,798 17.7% Community Facilities 1 167 0.1% Community Facilities 2 457 0.2% Community Facilities 3 205 0.1% Services only 1,363 0.6% Totalratesset 218,806 100%
Summaryoftotalproposedrevenuerequiredfrom2024-25rates
Note: The total rate revenue includes rates charged on Council-owned properties, rate refunds and rate remissions.
Ratesinstalmentdetails
The rates above are payable in six equal instalments on the following dates:
Penaltiesonunpaidrates
The Council resolves, pursuant to sections 57and 58 of the LocalGovernment (Rating) Act 2002, except as stated below*, that:
a. A penalty of 10percent will be added to the amount of any instalment remaining unpaid by the relevant due date above.
b. A penalty of 10percent will be added to the amount of any rates assessed in previous years remaining unpaid on 7 July 2024. The penalty will be added on 22 August 2024.
c. A further penalty of 10percent will be added to the amount of any rates to which a penaltyhas been added under b) above and which remain unpaid on 22 February 2025
282 | Page
Rate Amount (inclusive of GST) $000 Amount (exclusive of GST) $000 General Rate 136,121 118,366 Targeted Rates: Water Supply 32,078 27,894 Wastewater 35,123 30,542 Jackson Street 193 167 Refuse 9,052 7,871 Recycling 5,608 4,877 Green waste 631 549 Totalraterevenue 218,806 190,266
Instalment number Due date One 20 August 2024 Two 20 October 2024 Three 20 December 2024 Four 20 February 2025 Five 20 April 2025 Six 20 June 2025
*No penalty shall beadded toany rate account if:
• A direct debitauthority is inplace for payment of the rates by regular weekly, fortnightly or monthly instalments, and payment in full is made bythe end of the rating year.
• Any other satisfactory arrangement has been reached for payment of the current rates by regular instalments by the end of the rating year.
Ratingbase
Based on the projected increase of 1.1percent in the rating base eachyear, the following table shows the projected number of rating units in the cityasat 30 June:
The following table shows the projected capital and land value as at30 June 2024:
Examplesofratesonarangeoftypicalproperties
The examples below show how a range of properties are affected by the rates for 2024-25
283 | Page
2024 2025 2026 2027 2028 2029 2030 2031 2032 2033 2034 42,816 43,287 43,764 44,245 44,732 45,224 45,721 46,224 46,733 47,247 47,766
Land value Capitalvalue $25,792,209,604 $41,610,148,789
Property category Rateable value as at 1 July 2024 $ 2023-24 rates $ 2024-25 rates $ Change amount $ Average Residential $815,000 $3,348 $3,911 $563 Average Commercial Central $2,350,000 $19,367 $22,645 $3,278 Average Commercial Suburban $2,418,000 $16,501 $19,325 $2,824 Average Rural (no services) $1,247,000 $2,342 $2,696 $354 Property category Rateable value as at1 July 2024 General rate Water Waste water Rubbish and recyclin g Total $ $ $ $ $ $ Residential $600,000 $1,529 $746 $766 $322 $3,363 Residential $800,000 $2,038 $746 $766 $322 $3,872
284 | Page Property category Rateable value as at1 July 2024 General rate Water Waste water Rubbish and recyclin g Total $ $ $ $ $ $ Residential $1,000,000 $2,548 $746 $766 $322 $4,382 Residential $1,200,000 $3,058 $746 $766 $322 $4,892 Residential $1,400,000 $3,567 $746 $766 $322 $5,401 Residential $1,600,000 $4,077 $746 $766 $322 $5,911 Commercial Suburban $700,000 $5,046 $746 $1,149 $0 $6,941 Commercial Suburban $1,200,000 $8,650 $746 $1,149 $0 $10,545 Commercial Suburban $2,400,000 $17,300 $746 $1,149 $0 $19,195 Commercial Suburban $10,000,000 $72,083 $746 $1,149 $0 $73,978 Commercial Central $800,000 $7,064 $746 $1,149 $0 $8,959 Commercial Central $1,300,000 $11,479 $746 $1,149 $0 $13,374 Commercial Central $2,400,000 $21,191 $746 $1,149 $0 $23,086 Commercial Central $10,000,000 $88,296 $746 $1,149 $0 $90,191 Commercial Central (Queensgate) $282,000,000 $2,489,958 $10,817 $21,065 $0 $2,521,840 Utility Networks $3,000,000 $26,037 $0 $0 $0 $26,037 Rural $800,000 $1,523 $0 $0 $322 $1,845 Rural $1,000,000 $1,903 $0 $0 $322 $2,225 Rural $1,250,000 $2,379 $0 $0 $322 $2,701 Rural $2,500,000 $4,759 $0 $0 $322 $5,081 Community Facilities 1 $663,118 $168,432 $746 $1,149 $0 $170,327 Community Facilities 2 $1,396,351 $78,196 $746 $1,149 $0 $80,091 Community Facilities 3 $3,371,667 $1,304,835 $746 $1,149 $0 $1,306,730
285 | Page Residential suburbs: average rateable value Rateable value as at 1 July 2024 General rate Water Waste water Rubbish & Recycling Total $ $ $ $ $ $ Alicetown $899,500 $2,292 $746 $766 $322 $4,126 Avalon $760,000 $1,937 $746 $766 $322 $3,771 Belmont $972,500 $2,478 $746 $766 $322 $4,312 Boulcott $922,500 $2,351 $746 $766 $322 $4,185 Days Bay $1,294,500 $3,299 $746 $766 $322 $5,133 Eastbourne $1,217,800 $3,103 $746 $766 $322 $4,937 Epuni $834,900 $2,127 $746 $766 $322 $3,961 Fairfield $818,300 $2,085 $746 $766 $322 $3,919 Harbour View $912,100 $2,324 $746 $766 $322 $4,158 Haywards $632,500 $1,612 $746 $766 $322 $3,446 Hutt Central $1,080,800 $2,754 $746 $766 $322 $4,588 Kelson $879,600 $2,241 $746 $766 $322 $4,075 Korokoro $1,023,900 $2,609 $746 $766 $322 $4,443 Lowry Bay $1,661,600 $4,234 $746 $766 $322 $6,068 Manor Park $896,400 $2,284 $746 $766 $322 $4,118 Maungaraki $932,800 $2,377 $746 $766 $322 $4,211 Melling $766,900 $1,954 $746 $766 $322 $3,788 Moera $648,200 $1,652 $746 $766 $322 $3,486 Naenae $659,200 $1,680 $746 $766 $322 $3,514 Normandale $896,200 $2,284 $746 $766 $322 $4,118 Petone $950,800 $2,423 $746 $766 $322 $4,257 Point Howard $1,185,100 $3,020 $746 $766 $322 $4,854 Stokes Valley $648,800 $1,653 $746 $766 $322 $3,487 Taitā $661,400 $1,685 $746 $766 $322 $3,519 Wainuiomata $630,100 $1,606 $746 $766 $322 $3,440 Waiwhetū $802,800 $2,046 $746 $766 $322 $3,880 Waterloo $887,700 $2,262 $746 $766 $322 $4,096 Woburn $1,283,900 $3,272 $746 $766 $322 $5,106 York Bay $1,128,100 $2,875 $746 $766 $322 $4,709
Funding impact statements
286 | Page
WATERSUPPLY-FUNDINGIMPACTSTATEMENT Fortheyearending30June ForecastDraftbudget Forecast Forecast Forecast Forecast Forecast Forecast Forecast Forecast Forecast 2024 2025 2026 2027 2028 2029 2030 2031 2032 2033 2034 $000 $000 $000 $000 $000 $000 $000 $000 $000 $000 $000 Sourcesofoperatingfunding - - - - - - - - - -Generalrates,uniformannualgeneralcharges, ratespenalties - - - - - - - - - -Targetedrates 22,495 27,894 34,031 41,007 49,209 59,051 65,266 69,787 71,732 73,838 78,493 Subsidiesandgrantsforoperatingpurposes - - - - - - - - - -Feesandcharges 4,716 5,987 6,764 6,988 7,320 7,536 7,779 8,042 8,106 8,338 8,529 InternalChargesandOverheadsRecovered - - - - - - - - - -Localauthoritiesfueltax,fines,infringement fees,andotherreceipts 122 127 129 132 135 138 141 144 147 150 153 Totaloperatingfunding(A) 27,333 34,008 40,924 48,127 56,664 66,725 73,186 77,973 79,985 82,326 87,175 Applicationsofoperatingfunding Paymentstostaffandsuppliers 25,726 34,561 34,952 36,545 38,456 39,493 40,945 42,679 43,252 44,454 45,475 Financecosts 1,910 3,332 3,830 5,980 8,720 11,426 13,331 14,164 14,372 14,449 15,630 Internalchargesandoverheadsapplied 664 755 776 804 812 827 873 869 889 908 924 Otheroperatingfundingapplications - - - - - - - - - -Totalapplicationsofoperatingfunding(B) 28,300 38,648 39,558 43,329 47,988 51,746 55,149 57,712 58,513 59,811 62,029 Surplus(deficit)ofoperatingfunding(A-B) (967) (4,640) 1,366 4,798 8,676 14,979 18,037 20,261 21,472 22,515 25,146 Sourcesofcapitalfunding Subsidiesandgrantsforcapitalexpenditure - - - - - - - - - -Development&financialcontributions 1,163 3,370 4,134 4,413 4,407 4,328 5,056 4,722 4,406 4,245 4,272 Increase(decrease)indebt 35,457 17,971 18,175 42,251 69,676 65,236 23,569 9,787 3,440 857 35,821 Grossproceedsfromsaleofassets - - - - - - - - - -Lumpsumcontributions - - - - - - - - - -Otherdedicatedcapitalfunding - - - - - - - - - -Totalsourcesofcapitalfunding (C) 36,620 21,341 22,309 46,664 74,083 69,564 28,625 14,509 7,846 5,102 40,093 Applicationofcapitalfunding Capitalexpenditure -tomeetadditionaldemand 25 103 102 19,650 41,800 33,908 7,072 114 116 237 1,929 -toimprovelevelofservice 8,963 5,163 8,852 20,767 26,756 28,715 9,730 3,594 4,047 2,656 8,810 -toreplaceexistingassets 26,665 11,435 14,721 11,045 14,203 21,920 29,860 31,062 25,155 24,724 54,500 Increase(decrease)inreserves - - - - - - - - - -Increase(decrease)ofinvestments - - - - - - - - - -Totalapplicationsofcapitalfunding(D) 35,653 16,701 23,675 51,462 82,759 84,543 46,662 34,770 29,318 27,617 65,239 Surplus(deficit)ofcapitalfunding(C-D) 967 4,640 (1,366) (4,798) (8,676) (14,979) (18,037) (20,261) (21,472) (22,515) (25,146) Fundingbalance((A-B)+(C-D)) - - - - - - - - - -WASTEWATER-FUNDINGIMPACTSTATEMENT Fortheyearending30June ForecastDraftbudget Forecast Forecast Forecast Forecast Forecast Forecast Forecast Forecast Forecast 2024 2025 2026 2027 2028 2029 2030 2031 2032 2033 2034 $000 $000 $000 $000 $000 $000 $000 $000 $000 $000 $000 Sourcesofoperatingfunding - - - - - - - - - -Generalrates,uniformannualgeneralcharges, ratespenalties - - - - - - - - - -Targetedrates 25,839 30,542 36,100 42,671 49,071 56,432 63,414 69,285 74,100 81,693 89,373 Subsidiesandgrantsforoperatingpurposes 3,234 3,971 4,094 4,211 4,300 4,427 4,550 4,483 4,573 4,660 4,751 Feesandcharges 1,207 1,248 1,276 1,305 1,335 1,364 1,393 1,421 1,449 1,477 1,505 InternalChargesandOverheadsRecovered - - - - - - - - - -Localauthoritiesfueltax,fines,infringement fees,andotherreceipts 122 127 129 132 135 138 141 144 147 150 153 Totaloperatingfunding(A) 30,402 35,888 41,599 48,319 54,841 62,361 69,498 75,333 80,269 87,980 95,782 Applicationsofoperatingfunding Paymentstostaffandsuppliers 20,147 22,944 23,891 24,483 25,372 26,167 26,594 26,750 27,364 27,973 28,685 Financecosts 2,430 5,035 7,203 9,652 10,368 11,309 13,031 14,554 15,747 18,570 19,411 Internalchargesandoverheadsapplied 1,098 1,333 1,370 1,415 1,433 1,461 1,530 1,530 1,566 1,599 1,627 Otheroperatingfundingapplications - - - - - - - - - -Totalapplicationsofoperatingfunding(B) 23,675 29,312 32,464 35,550 37,173 38,937 41,155 42,834 44,677 48,142 49,723 Surplus(deficit)ofoperatingfunding(A-B) 6,727 6,576 9,135 12,769 17,668 23,424 28,343 32,499 35,592 39,838 46,059 Sourcesofcapitalfunding Subsidiesandgrantsforcapitalexpenditure 7,958 10,399 22,201 18,621 8,516 14,793 14,673 17,663 21,670 37,848 5,227 Development&financialcontributions 775 3,615 4,656 5,351 5,664 5,828 7,100 6,940 6,739 6,603 6,651 Increase(decrease)indebt 26,766 43,334 65,665 40,782 11,188 24,109 17,893 24,284 25,068 58,576 30,921 Grossproceedsfromsaleofassets - - - - - - - - - -Lumpsumcontributions - - - - - - - - - -Otherdedicatedcapitalfunding - - - - - - - - - -Totalsourcesofcapitalfunding (C) 35,499 57,348 92,522 64,754 25,368 44,730 39,666 48,887 53,477 103,027 42,799 Applicationofcapitalfunding Capitalexpenditure -tomeetadditionaldemand 2,828 17,225 22,626 4,930 5,842 7,670 12,147 6,931 116 118 7,650 -toimprovelevelofservice 4,637 2,423 1,791 2,475 1,818 2,566 3,426 13,966 15,604 12,851 25,255 -toreplaceexistingassets 34,761 44,276 77,240 70,118 35,376 57,918 52,436 60,489 73,349 129,896 55,953 Increase(decrease)inreserves - - - - - - - - - -Increase(decrease)ofinvestments - - - - - - - - - -Totalapplicationsofcapitalfunding(D) 42,226 63,924 101,657 77,523 43,036 68,154 68,009 81,386 89,069 142,865 88,858 Surplus(deficit)ofcapitalfunding(C-D) (6,727) (6,576) (9,135) (12,769) (17,668) (23,424) (28,343) (32,499) (35,592) (39,838) (46,059) Fundingbalance((A-B)+(C-D)) - - - - - - - - - - -
287 | Page STORMWATER-FUNDINGIMPACTSTATEMENT Fortheyearending30June ForecastDraftbudget Forecast Forecast Forecast Forecast Forecast Forecast Forecast Forecast Forecast 2024 2025 2026 2027 2028 2029 2030 2031 2032 2033 2034 $000 $000 $000 $000 $000 $000 $000 $000 $000 $000 $000 Sourcesofoperatingfunding Generalrates,uniformannualgeneralcharges, ratespenalties 8,525 11,413 13,565 15,672 17,306 18,382 21,437 24,644 28,266 32,169 36,132 Targetedrates - - - - - - - - - -Subsidiesandgrantsforoperatingpurposes 9 9 9 10 10 10 10 11 11 11 11 Feesandcharges 12 13 13 13 14 14 14 15 15 15 15 InternalChargesandOverheadsRecovered 4,228 3,957 3,750 3,720 3,520 3,103 1,766 902 - -Localauthoritiesfueltax,fines,infringement fees,andotherreceipts 122 127 129 132 135 138 141 144 147 150 153 Totaloperatingfunding(A) 12,896 15,519 17,466 19,547 20,985 21,647 23,368 25,716 28,439 32,345 36,311 Applicationsofoperatingfunding Paymentstostaffandsuppliers 6,223 7,117 7,381 7,700 8,056 8,290 8,573 8,924 9,144 9,371 9,677 Financecosts 681 1,351 2,106 2,719 2,710 2,770 3,733 4,609 5,167 5,716 5,710 Internalchargesandoverheadsapplied 384 587 603 624 631 642 677 675 2,019 4,528 6,980 Otheroperatingfundingapplications - - - - - - - - - -Totalapplicationsofoperatingfunding(B) 7,288 9,055 10,090 11,043 11,397 11,702 12,983 14,208 16,330 19,615 22,367 Surplus(deficit)ofoperatingfunding(A-B) 5,608 6,464 7,376 8,504 9,588 9,945 10,385 11,508 12,109 12,730 13,944 Sourcesofcapitalfunding Subsidiesandgrantsforcapitalexpenditure 3,010 13,099 36,317 33,732 12,742 - - - - -Development&financialcontributions 119 1,114 1,535 1,943 2,177 2,314 2,906 2,949 2,945 2,905 2,921 Increase(decrease)indebt 4,332 7,194 19,030 6,281 (1,926) 218 15,302 17,331 15,596 17,727 12,961 Grossproceedsfromsaleofassets - - - - - - - - - -Lumpsumcontributions - - - - - - - - - -Otherdedicatedcapitalfunding - - - - - - - - - -Totalsourcesofcapitalfunding (C) 7,461 21,407 56,882 41,956 12,993 2,532 18,208 20,280 18,541 20,632 15,882 Applicationofcapitalfunding Capitalexpenditure -tomeetadditionaldemand 6,120 22,376 51,792 45,333 17,741 5,247 5,913 9,187 9,370 6,034 1,326 -toimprovelevelofservice 574 1,292 4,637 4,098 2,329 4,381 13,334 18,227 18,823 21,819 25,441 -toreplaceexistingassets 6,375 4,203 7,829 1,029 2,511 2,849 9,346 4,374 2,457 5,509 3,059 Increase(decrease)inreserves - - - - - - - - - -Increase(decrease)ofinvestments - - - - - - - - - -Totalapplicationsofcapitalfunding(D) 13,069 27,871 64,258 50,460 22,581 12,477 28,593 31,788 30,650 33,362 29,826 Surplus(deficit)ofcapitalfunding(C-D) (5,608) (6,464) (7,376) (8,504) (9,588) (9,945) (10,385) (11,508) (12,109) (12,730) (13,944) Fundingbalance((A-B)+(C-D)) - - - - - - - - - -SOILDWASTE-FUNDINGIMPACTSTATEMENT Fortheyearending30June ForecastDraftbudget Forecast Forecast Forecast Forecast Forecast Forecast Forecast Forecast Forecast 2024 2025 2026 2027 2028 2029 2030 2031 2032 2033 2034 $000 $000 $000 $000 $000 $000 $000 $000 $000 $000 $000 Sourcesofoperatingfunding Generalrates,uniformannualgeneralcharges, ratespenalties - - - - - - - - - -Targetedrates 12,204 13,296 13,728 14,039 19,411 19,903 20,392 20,876 21,365 21,850 22,334 Subsidiesandgrantsforoperatingpurposes - - - - - - - - - -Feesandcharges 30,698 35,075 37,157 38,463 39,730 40,958 42,150 43,309 44,419 45,490 46,549 InternalChargesandOverheadsRecovered - - - - - - - - - -Localauthoritiesfueltax,fines,infringement fees,andotherreceipts - 30 31 31 32 33 33 34 35 35 36 Totaloperatingfunding(A) 42,902 48,401 50,916 52,533 59,173 60,894 62,575 64,219 65,819 67,375 68,919 Applicationsofoperatingfunding Paymentstostaffandsuppliers 28,438 32,084 32,642 32,165 38,466 39,067 39,654 40,235 40,830 41,435 42,049 Financecosts 483 390 394 408 419 427 434 444 454 460 466 Internalchargesandoverheadsapplied 958 1,197 1,252 1,285 1,312 1,339 1,402 1,390 1,426 1,456 1,494 Otheroperatingfundingapplications - - - - - - - - - -Totalapplicationsofoperatingfunding(B) 29,879 33,671 34,288 33,858 40,197 40,833 41,490 42,069 42,710 43,351 44,009 Surplus(deficit)ofoperatingfunding(A-B) 13,023 14,730 16,628 18,675 18,976 20,061 21,085 22,150 23,109 24,024 24,910 Sourcesofcapitalfunding Subsidiesandgrantsforcapitalexpenditure - 500 - 2,500 - - - - - -Development&financialcontributions - - - - - - - - - -Increase(decrease)indebt (2,759) (5,181) (6,833) (8,984) (10,054) (15,871) (17,566) (17,643) (22,698) (20,096) (24,582) Grossproceedsfromsaleofassets - - - - - - - - - -Lumpsumcontributions - - - - - - - - - -Otherdedicatedcapitalfunding - - - - - - - - - -Totalsourcesofcapitalfunding (C) (2,759) (4,681) (6,833) (6,484) (10,054) (15,871) (17,566) (17,643) (22,698) (20,096) (24,582) Applicationofcapitalfunding Capitalexpenditure -tomeetadditionaldemand - - - - - - - - - --toimprovelevelofservice 10,264 10,049 9,795 12,191 8,922 4,190 3,519 4,507 411 3,928 328 -toreplaceexistingassets - - - - - - - - - -Increase(decrease)inreserves - - - - - - - - - -Increase(decrease)ofinvestments - - - - - - - - - -Totalapplicationsofcapitalfunding(D) 10,264 10,049 9,795 12,191 8,922 4,190 3,519 4,507 411 3,928 328 Surplus(deficit)ofcapitalfunding(C-D) (13,023) (14,730) (16,628) (18,675) (18,976) (20,061) (21,085) (22,150) (23,109) (24,024) (24,910) Fundingbalance((A-B)+(C-D)) - - - - - - - - - - -
288 | Page SUSTAINABILITY&RESILIENCE-FUNDINGIMPACTSTATEMENT Fortheyearending30June ForecastDraftbudget Forecast Forecast Forecast Forecast Forecast Forecast Forecast Forecast Forecast 2024 2025 2026 2027 2028 2029 2030 2031 2032 2033 2034 $000 $000 $000 $000 $000 $000 $000 $000 $000 $000 $000 Sourcesofoperatingfunding Generalrates,uniformannualgeneralcharges, ratespenalties 1,109 2,082 2,216 2,336 2,459 2,581 2,865 3,036 3,331 3,572 3,665 Targetedrates - - - - - - - - - -Subsidiesandgrantsforoperatingpurposes - - - - - - - - - -Feesandcharges 118 122 152 190 234 239 244 249 254 259 263 InternalChargesandOverheadsRecovered 550 722 613 555 500 436 236 111 - -Localauthoritiesfueltax,fines,infringement fees,andotherreceipts 1,984 2,191 2,239 2,291 2,344 2,395 2,445 2,494 2,544 2,593 2,642 Totaloperatingfunding(A) 3,761 5,117 5,220 5,372 5,537 5,651 5,790 5,890 6,129 6,424 6,570 Applicationsofoperatingfunding Paymentstostaffandsuppliers 3,067 4,029 4,117 4,216 4,339 4,423 4,521 4,618 4,716 4,812 4,799 Financecosts 121 185 191 226 249 252 260 254 229 196 142 Internalchargesandoverheadsapplied 539 789 798 816 835 864 898 906 1,073 1,371 1,614 Otheroperatingfundingapplications - - - - - - - - - -Totalapplicationsofoperatingfunding(B) 3,727 5,003 5,106 5,258 5,423 5,539 5,679 5,778 6,018 6,379 6,555 Surplus(deficit)ofoperatingfunding(A-B) 34 114 114 114 114 112 111 112 111 45 15 Sourcesofcapitalfunding Subsidiesandgrantsforcapitalexpenditure 255 - - - - - - - - -Development&financialcontributions - - - - - - - - - -Increase(decrease)indebt 2 (114) (114) (114) (114) (112) (111) (112) (111) (45) (15) Grossproceedsfromsaleofassets - - - - - - - - - -Lumpsumcontributions - - - - - - - - - -Otherdedicatedcapitalfunding - - - - - - - - - -Totalsourcesofcapitalfunding (C) 257 (114) (114) (114) (114) (112) (111) (112) (111) (45) (15) Applicationofcapitalfunding Capitalexpenditure -tomeetadditionaldemand - - - - - - - - - --toimprovelevelofservice 250 - - - - - - - - --toreplaceexistingassets 41 - - - - - - - - -Increase(decrease)inreserves - - - - - - - - - -Increase(decrease)ofinvestments - - - - - - - - - -Totalapplicationsofcapitalfunding(D) 291 - - - - - - - - -Surplus(deficit)ofcapitalfunding(C-D) (34) (114) (114) (114) (114) (112) (111) (112) (111) (45) (15) Fundingbalance((A-B)+(C-D)) - - - - - - - - - -REGULATORYSERVICES-FUNDINGIMPACTSTATEMENT Fortheyearending30June ForecastDraftbudget Forecast Forecast Forecast Forecast Forecast Forecast Forecast Forecast Forecast 2024 2025 2026 2027 2028 2029 2030 2031 2032 2033 2034 $000 $000 $000 $000 $000 $000 $000 $000 $000 $000 $000 Sourcesofoperatingfunding Generalrates,uniformannualgeneralcharges, ratespenalties 4,130 5,086 5,398 5,738 6,015 6,371 7,122 7,493 7,994 8,679 9,440 Targetedrates - - - - - - - - - -Subsidiesandgrantsforoperatingpurposes - - - - - - - - - -Feesandcharges 8,697 10,402 10,786 11,065 11,381 11,668 11,985 12,274 12,570 12,863 13,170 InternalChargesandOverheadsRecovered 2,049 1,763 1,492 1,362 1,223 1,075 587 274 - -Localauthoritiesfueltax,fines,infringement fees,andotherreceipts 1,354 1,185 1,213 1,239 1,268 1,298 1,323 1,349 1,379 1,402 1,429 Totaloperatingfunding(A) 16,230 18,436 18,889 19,404 19,887 20,412 21,017 21,390 21,943 22,944 24,039 Applicationsofoperatingfunding Paymentstostaffandsuppliers 11,910 13,598 14,094 14,516 14,907 15,264 15,647 16,000 16,436 16,785 17,220 Financecosts 279 446 463 554 614 634 661 660 607 525 392 Internalchargesandoverheadsapplied 3,951 4,402 4,149 4,230 4,262 4,412 4,620 4,645 4,830 5,571 6,361 Otheroperatingfundingapplications - - - - - - - - - -Totalapplicationsofoperatingfunding(B) 16,140 18,446 18,706 19,300 19,783 20,310 20,928 21,305 21,873 22,881 23,973 Surplus(deficit)ofoperatingfunding(A-B) 90 (10) 183 104 104 102 89 85 70 63 66 Sourcesofcapitalfunding Subsidiesandgrantsforcapitalexpenditure - - - - - - - - - -Development&financialcontributions - - - - - - - - - -Increase(decrease)indebt (90) 10 (183) (104) (104) (102) (89) (85) (70) (63) (66) Grossproceedsfromsaleofassets - - - - - - - - - -Lumpsumcontributions - - - - - - - - - -Otherdedicatedcapitalfunding - - - - - - - - - -Totalsourcesofcapitalfunding (C) (90) 10 (183) (104) (104) (102) (89) (85) (70) (63) (66) Applicationofcapitalfunding Capitalexpenditure -tomeetadditionaldemand - - - - - - - - - --toimprovelevelofservice - - - - - - - - - --toreplaceexistingassets - - - - - - - - - -Increase(decrease)inreserves - - - - - - - - - -Increase(decrease)ofinvestments - - - - - - - - - -Totalapplicationsofcapitalfunding(D) - - - - - - - - - -Surplus(deficit)ofcapitalfunding(C-D) (90) 10 (183) (104) (104) (102) (89) (85) (70) (63) (66) Fundingbalance((A-B)+(C-D)) - - - - - - - - - - -
289 | Page TRANSPORT-FUNDINGIMPACTSTATEMENT Fortheyearending30June ForecastDraftbudget Forecast Forecast Forecast Forecast Forecast Forecast Forecast Forecast Forecast 2024 2025 2026 2027 2028 2029 2030 2031 2032 2033 2034 $000 $000 $000 $000 $000 $000 $000 $000 $000 $000 $000 Sourcesofoperatingfunding Generalrates,uniformannualgeneralcharges, ratespenalties 23,922 27,941 31,902 34,896 39,665 45,917 53,068 58,618 64,613 70,676 80,039 Targetedrates - - - - - - - - - -Subsidiesandgrantsforoperatingpurposes 5,917 8,150 8,329 8,520 8,717 8,908 9,095 9,277 9,462 9,643 9,826 Feesandcharges 5,516 7,505 7,857 8,116 8,536 8,723 8,906 9,085 9,266 9,442 9,622 InternalChargesandOverheadsRecovered 11,866 9,688 8,820 8,284 8,068 7,751 4,372 2,145 - -Localauthoritiesfueltax,fines,infringement fees,andotherreceipts 1,094 1,131 1,156 1,182 1,210 1,237 1,263 1,288 1,314 1,338 1,363 Totaloperatingfunding(A) 48,315 54,415 58,064 60,998 66,196 72,536 76,704 80,413 84,655 91,099 100,850 Applicationsofoperatingfunding Paymentstostaffandsuppliers 21,895 24,192 24,686 25,145 25,301 25,894 26,452 26,979 27,534 28,082 28,640 Financecosts 2,297 3,030 3,247 3,406 3,384 3,671 3,592 2,928 1,289 46 45 Internalchargesandoverheadsapplied 4,414 4,496 4,700 4,798 4,919 5,047 5,242 5,215 8,334 13,805 19,452 Otheroperatingfundingapplications - - - - - - - - - -Totalapplicationsofoperatingfunding(B) 28,606 31,718 32,633 33,349 33,604 34,612 35,286 35,122 37,157 41,933 48,137 Surplus(deficit)ofoperatingfunding(A-B) 19,709 22,697 25,431 27,649 32,592 37,924 41,418 45,291 47,498 49,166 52,713 Sourcesofcapitalfunding Subsidiesandgrantsforcapitalexpenditure 31,843 39,354 33,139 12,028 35,328 45,134 31,564 33,070 22,383 10,248 10,442 Development&financialcontributions 428 1,123 1,471 1,733 1,853 1,912 2,335 2,292 2,231 2,179 2,185 Increase(decrease)indebt 4,007 5,327 2,917 (15,615) 2,921 5,741 (11,399) (13,761) (25,696) (38,923) (42,014) Grossproceedsfromsaleofassets - - - - - - - - - -Lumpsumcontributions - - - - - - - - - -Otherdedicatedcapitalfunding - - - - - - - - - -Totalsourcesofcapitalfunding (C) 36,278 45,804 37,527 (1,854) 40,102 52,787 22,500 21,601 (1,082) (26,496) (29,387) Applicationofcapitalfunding Capitalexpenditure -tomeetadditionaldemand 278 4,311 4,055 4,050 6,495 7,339 6,031 6,256 5,528 4,402 4,486 -toimprovelevelofservice 41,515 49,960 43,485 6,711 50,969 69,094 43,519 45,984 26,037 3,134 3,194 -toreplaceexistingassets 14,194 14,230 15,418 15,034 15,230 14,278 14,368 14,652 14,851 15,134 15,646 Increase(decrease)inreserves - - - - - - - - - -Increase(decrease)ofinvestments - - - - - - - - - -Totalapplicationsofcapitalfunding(D) 55,987 68,501 62,958 25,795 72,694 90,711 63,918 66,892 46,416 22,670 23,326 Surplus(deficit)ofcapitalfunding(C-D) (19,709) (22,697) (25,431) (27,649) (32,592) (37,924) (41,418) (45,291) (47,498) (49,166) (52,713) Fundingbalance((A-B)+(C-D)) - - - - - - - - - -CITYDEVELOPMENT-FUNDINGIMPACTSTATEMENT Fortheyearending30June ForecastDraftbudget Forecast Forecast Forecast Forecast Forecast Forecast Forecast Forecast Forecast 2024 2025 2026 2027 2028 2029 2030 2031 2032 2033 2034 $000 $000 $000 $000 $000 $000 $000 $000 $000 $000 $000 Sourcesofoperatingfunding Generalrates,uniformannualgeneralcharges, ratespenalties 12,574 10,768 9,916 10,827 11,479 13,178 14,837 15,823 17,299 18,692 19,528 Targetedrates 158 171 174 178 181 184 187 191 194 197 201 Subsidiesandgrantsforoperatingpurposes - - - - - - - - - -Feesandcharges 84 87 89 91 93 95 97 99 101 103 105 InternalChargesandOverheadsRecovered 6,237 3,734 2,741 2,570 2,335 2,224 1,222 579 - -Localauthoritiesfueltax,fines,infringement fees,andotherreceipts - - - - - - - - - -Totaloperatingfunding(A) 19,053 14,760 12,920 13,666 14,088 15,681 16,343 16,692 17,594 18,992 19,834 Applicationsofoperatingfunding Paymentstostaffandsuppliers 14,549 8,139 5,412 4,767 4,179 4,305 4,347 4,451 4,567 4,594 4,701 Financecosts 2,183 3,578 4,390 5,692 6,653 8,030 8,512 8,732 8,684 8,563 8,037 Internalchargesandoverheadsapplied 2,309 3,050 3,088 3,177 3,224 3,314 3,455 3,482 4,316 5,808 7,068 Otheroperatingfundingapplications - - - - - - - - - -Totalapplicationsofoperatingfunding(B) 19,041 14,767 12,890 13,636 14,056 15,649 16,314 16,665 17,567 18,965 19,806 Surplus(deficit)ofoperatingfunding(A-B) 12 (7) 30 30 32 32 29 27 27 27 28 Sourcesofcapitalfunding Subsidiesandgrantsforcapitalexpenditure 5,043 13,184 19,040 4,282 - - - - - -Development&financialcontributions - - - - - - - - - -Increase(decrease)indebt 22,852 19,902 24,938 14,141 17,040 31,782 693 475 412 907 465 Grossproceedsfromsaleofassets - 1,073 1,093 5,591 5,737 5,892 - - - -Lumpsumcontributions - - - - - - - - - -Otherdedicatedcapitalfunding - - - - - - - - - -Totalsourcesofcapitalfunding (C) 27,895 34,159 45,071 24,014 22,777 37,674 693 475 412 907 465 Applicationofcapitalfunding Capitalexpenditure -tomeetadditionaldemand 2,060 - - - - - - - - --toimprovelevelofservice 25,847 34,095 45,064 23,246 22,273 37,658 243 248 253 258 262 -toreplaceexistingassets - 57 37 798 536 48 479 254 186 676 231 Increase(decrease)inreserves - - - - - - - - - -Increase(decrease)ofinvestments - - - - - - - - - -Totalapplicationsofcapitalfunding(D) 27,907 34,152 45,101 24,044 22,809 37,706 722 502 439 934 493 Surplus(deficit)ofcapitalfunding(C-D) (12) 7 (30) (30) (32) (32) (29) (27) (27) (27) (28) Fundingbalance((A-B)+(C-D)) - - - - - - - - - - -
290 | Page COMMUNITYPARTNERING&SUPPORT-FUNDINGIMPACTSTATEMENT Fortheyearending30June ForecastDraftbudget Forecast Forecast Forecast Forecast Forecast Forecast Forecast Forecast Forecast 2024 2025 2026 2027 2028 2029 2030 2031 2032 2033 2034 $000 $000 $000 $000 $000 $000 $000 $000 $000 $000 $000 Sourcesofoperatingfunding Generalrates,uniformannualgeneralcharges, ratespenalties 7,405 10,135 10,994 11,667 12,564 13,214 15,003 15,941 17,424 18,985 20,562 Targetedrates - - - - - - - - - -Subsidiesandgrantsforoperatingpurposes 5 5 6 6 6 6 6 6 6 6 7 Feesandcharges 477 518 529 542 554 549 560 572 583 594 605 InternalChargesandOverheadsRecovered 3,673 3,514 3,040 2,769 2,555 2,230 1,236 583 - -Localauthoritiesfueltax,fines,infringement fees,andotherreceipts 994 1,031 1,053 11 11 11 12 12 12 12 13 Totaloperatingfunding(A) 12,554 15,203 15,622 14,995 15,690 16,010 16,817 17,114 18,025 19,597 21,187 Applicationsofoperatingfunding Paymentstostaffandsuppliers 8,877 8,512 8,783 7,882 8,045 8,097 8,282 8,460 8,648 8,840 9,026 Financecosts 432 661 695 856 953 925 1,067 970 779 485 114 Internalchargesandoverheadsapplied 1,798 4,313 4,365 4,387 4,589 4,760 4,995 4,864 5,689 7,240 8,847 Otheroperatingfundingapplications - - - - - - - - - -Totalapplicationsofoperatingfunding(B) 11,107 13,486 13,843 13,125 13,587 13,782 14,344 14,294 15,116 16,565 17,987 Surplus(deficit)ofoperatingfunding(A-B) 1,447 1,717 1,779 1,870 2,103 2,228 2,473 2,820 2,909 3,032 3,200 Sourcesofcapitalfunding Subsidiesandgrantsforcapitalexpenditure - - - - - - - - - -Development&financialcontributions - - - - - - - - - -Increase(decrease)indebt (254) (1,227) (774) (408) (80) (1,673) 1,728 (1,981) (1,802) (2,359) (2,462) Grossproceedsfromsaleofassets - - - - - - - - - -Lumpsumcontributions - - - - - - - - - -Otherdedicatedcapitalfunding - - - - - - - - - -Totalsourcesofcapitalfunding (C) (254) (1,227) (774) (408) (80) (1,673) 1,728 (1,981) (1,802) (2,359) (2,462) Applicationofcapitalfunding Capitalexpenditure -tomeetadditionaldemand - - - - - - - - - --toimprovelevelofservice 594 5 61 526 111 65 1,047 6 70 595 7 -toreplaceexistingassets 599 485 944 936 1,912 490 3,154 833 1,037 78 731 Increase(decrease)inreserves - - - - - - - - - -Increase(decrease)ofinvestments - - - - - - - - - -Totalapplicationsofcapitalfunding(D) 1,193 490 1,005 1,462 2,023 555 4,201 839 1,107 673 738 Surplus(deficit)ofcapitalfunding(C-D) (1,447) (1,717) (1,779) (1,870) (2,103) (2,228) (2,473) (2,820) (2,909) (3,032) (3,200) Fundingbalance((A-B)+(C-D)) - - - - - - - - - -OPENSPACES,PARKS&RESERVES-FUNDINGIMPACTSTATEMENT Fortheyearending30June ForecastDraftbudget Forecast Forecast Forecast Forecast Forecast Forecast Forecast Forecast Forecast 2024 2025 2026 2027 2028 2029 2030 2031 2032 2033 2034 $000 $000 $000 $000 $000 $000 $000 $000 $000 $000 $000 Sourcesofoperatingfunding Generalrates,uniformannualgeneralcharges, ratespenalties 14,829 15,661 17,061 21,107 19,580 21,032 23,788 25,490 27,182 29,910 30,068 Targetedrates - - - - - - - - - -Subsidiesandgrantsforoperatingpurposes 6 6 6 6 6 7 7 7 7 7 7 Feesandcharges 1,553 1,652 1,806 2,012 2,060 1,950 1,993 2,035 2,078 2,120 2,162 InternalChargesandOverheadsRecovered 7,355 5,430 4,717 5,011 3,983 3,550 1,960 933 - -Localauthoritiesfueltax,fines,infringement fees,andotherreceipts 108 112 115 117 120 123 125 128 130 133 135 Totaloperatingfunding(A) 23,851 22,861 23,705 28,253 25,749 26,662 27,873 28,593 29,397 32,170 32,372 Applicationsofoperatingfunding Paymentstostaffandsuppliers 18,002 16,070 16,263 19,628 16,149 16,464 16,952 17,429 17,987 18,935 17,648 Financecosts 1,046 1,746 1,930 2,440 2,633 2,920 3,191 2,995 2,727 2,235 1,527 Internalchargesandoverheadsapplied 1,406 1,053 1,103 1,125 1,169 1,205 1,274 1,241 2,555 4,866 6,584 Otheroperatingfundingapplications - - - - - - - - - -Totalapplicationsofoperatingfunding(B) 20,454 18,869 19,296 23,193 19,951 20,589 21,417 21,665 23,269 26,036 25,759 Surplus(deficit)ofoperatingfunding(A-B) 3,397 3,992 4,409 5,060 5,798 6,073 6,456 6,928 6,128 6,134 6,613 Sourcesofcapitalfunding Subsidiesandgrantsforcapitalexpenditure 100 - - - - - - - - -Development&financialcontributions 2,500 3,000 3,000 3,000 3,000 3,000 3,000 3,000 3,000 3,000 3,000 Increase(decrease)indebt 1,287 6,486 3,404 1,657 522 5,291 1,469 (4,769) (2,267) (4,482) (5,959) Grossproceedsfromsaleofassets - - - - - - - - - -Lumpsumcontributions - - - - - - - - - -Otherdedicatedcapitalfunding - - - - - - - - - -Totalsourcesofcapitalfunding (C) 3,887 9,486 6,404 4,657 3,522 8,291 4,469 (1,769) 733 (1,482) (2,959) Applicationofcapitalfunding Capitalexpenditure -tomeetadditionaldemand 1,400 7,750 4,800 2,750 4,450 5,550 300 200 100 50-toimprovelevelofservice 2,651 3,138 3,071 3,218 1,422 6,224 8,792 1,859 4,288 1,156 1,672 -toreplaceexistingassets 3,233 2,590 2,942 3,749 3,448 2,590 1,833 3,100 2,473 3,446 1,982 Increase(decrease)inreserves - - - - - - - - - -Increase(decrease)ofinvestments - - - - - - - - - -Totalapplicationsofcapitalfunding(D) 7,284 13,478 10,813 9,717 9,320 14,364 10,925 5,159 6,861 4,652 3,654 Surplus(deficit)ofcapitalfunding(C-D) (3,397) (3,992) (4,409) (5,060) (5,798) (6,073) (6,456) (6,928) (6,128) (6,134) (6,613) Fundingbalance((A-B)+(C-D)) - - - - - - - - - - -
291 | Page CONNECTIVITY,CREATIVITY,LEARNING.&RECREATION-FUNDINGIMPACTSTATEMENT Fortheyearending30June ForecastDraftbudget Forecast Forecast Forecast Forecast Forecast Forecast Forecast Forecast Forecast 2024 2025 2026 2027 2028 2029 2030 2031 2032 2033 2034 $000 $000 $000 $000 $000 $000 $000 $000 $000 $000 $000 Sourcesofoperatingfunding Generalrates,uniformannualgeneralcharges, ratespenalties 17,628 22,496 25,235 27,605 29,616 30,969 34,431 36,888 42,118 45,960 49,227 Targetedrates - - - - - - - - - -Subsidiesandgrantsforoperatingpurposes 36 - - - - - - - - -Feesandcharges 4,123 5,009 6,025 6,170 6,318 6,464 6,607 6,747 6,890 7,031 7,180 InternalChargesandOverheadsRecovered 8,744 7,800 6,976 6,553 6,024 5,228 2,837 1,350 - -Localauthoritiesfueltax,fines,infringement fees,andotherreceipts 735 738 754 719 736 752 768 783 799 814 830 Totaloperatingfunding(A) 31,266 36,043 38,990 41,047 42,694 43,413 44,643 45,768 49,807 53,805 57,237 Applicationsofoperatingfunding Paymentstostaffandsuppliers 16,065 18,116 19,747 20,463 20,741 21,251 21,705 22,225 22,742 23,272 23,817 Financecosts 3,220 4,495 4,420 5,231 5,635 5,453 5,624 5,365 6,416 5,676 4,456 Internalchargesandoverheadsapplied 7,720 7,117 7,081 7,335 7,491 7,758 8,119 8,287 10,187 13,889 17,294 Otheroperatingfundingapplications - - - - - - - - - -Totalapplicationsofoperatingfunding(B) 27,005 29,728 31,248 33,029 33,867 34,462 35,448 35,877 39,345 42,837 45,567 Surplus(deficit)ofoperatingfunding(A-B) 4,261 6,315 7,742 8,018 8,827 8,951 9,195 9,891 10,462 10,968 11,670 Sourcesofcapitalfunding Subsidiesandgrantsforcapitalexpenditure 17,650 2,700 - - - - - - - -Development&financialcontributions - - - - - - - - - -Increase(decrease)indebt 12,536 (3,898) (1,822) 1,227 414 (6,695) (3,308) (6,978) 27,709 (6,510) (9,339) Grossproceedsfromsaleofassets - - - - - - - - - -Lumpsumcontributions - - - - - - - - - -Otherdedicatedcapitalfunding - - - - - - - - - -Totalsourcesofcapitalfunding (C) 30,186 (1,198) (1,822) 1,227 414 (6,695) (3,308) (6,978) 27,709 (6,510) (9,339) Applicationofcapitalfunding Capitalexpenditure -tomeetadditionaldemand - - - - - - - - - --toimprovelevelofservice 30,929 3,348 956 825 1,457 976 2,664 817 36,366 2,198 614 -toreplaceexistingassets 3,518 1,769 4,964 8,420 7,784 1,280 3,223 2,096 1,805 2,260 1,717 Increase(decrease)inreserves - - - - - - - - - -Increase(decrease)ofinvestments - - - - - - - - - -Totalapplicationsofcapitalfunding(D) 34,447 5,117 5,920 9,245 9,241 2,256 5,887 2,913 38,171 4,458 2,331 Surplus(deficit)ofcapitalfunding(C-D) (4,261) (6,315) (7,742) (8,018) (8,827) (8,951) (9,195) (9,891) (10,462) (10,968) (11,670) Fundingbalance((A-B)+(C-D)) - - - - - - - - - -GOVERNANCE,STRATEGY&PARTNERSHIPS-FUNDINGIMPACTSTATEMENT Fortheyearending30June ForecastDraftbudget Forecast Forecast Forecast Forecast Forecast Forecast Forecast Forecast Forecast 2024 2025 2026 2027 2028 2029 2030 2031 2032 2033 2034 $000 $000 $000 $000 $000 $000 $000 $000 $000 $000 $000 Sourcesofoperatingfunding Generalrates,uniformannualgeneralcharges, ratespenalties 4,794 6,138 6,988 7,141 7,451 8,210 8,769 9,283 10,685 11,372 12,354 Targetedrates - - - - - - - - - -Subsidiesandgrantsforoperatingpurposes - - - - - - - - - -Feesandcharges - - - - - - - - - -InternalChargesandOverheadsRecovered 2,379 2,128 1,932 1,695 1,515 1,386 722 340 - -Localauthoritiesfueltax,fines,infringement fees,andotherreceipts - - 230 - - 246 - - 261 -Totaloperatingfunding(A) 7,173 8,266 9,150 8,836 8,966 9,842 9,491 9,623 10,946 11,372 12,354 Applicationsofoperatingfunding Paymentstostaffandsuppliers 3,118 3,591 4,225 3,773 3,877 4,545 4,042 4,146 4,851 4,312 4,421 Financecosts - - - - - - - - - -Internalchargesandoverheadsapplied 4,083 4,669 4,922 5,063 5,089 5,297 5,449 5,477 6,095 7,060 7,933 Otheroperatingfundingapplications - - - - - - - - - -Totalapplicationsofoperatingfunding(B) 7,201 8,260 9,147 8,836 8,966 9,842 9,491 9,623 10,946 11,372 12,354 Surplus(deficit)ofoperatingfunding(A-B) (28) 6 3 - - - - - - -Sourcesofcapitalfunding Subsidiesandgrantsforcapitalexpenditure - - - - - - - - - -Development&financialcontributions - - - - - - - - - -Increase(decrease)indebt 28 (6) (3) - - - - - - -Grossproceedsfromsaleofassets - - - - - - - - - -Lumpsumcontributions - - - - - - - - - -Otherdedicatedcapitalfunding - - - - - - - - - -Totalsourcesofcapitalfunding (C) 28 (6) (3) - - - - - - -Applicationofcapitalfunding Capitalexpenditure -tomeetadditionaldemand - - - - - - - - - --toimprovelevelofservice - - - - - - - - - --toreplaceexistingassets - - - - - - - - - -Increase(decrease)inreserves - - - - - - - - - -Increase(decrease)ofinvestments - - - - - - - - - -Totalapplicationsofcapitalfunding(D) - - - - - - - - - -Surplus(deficit)ofcapitalfunding(C-D) 28 (6) (3) - - - - - - -Fundingbalance((A-B)+(C-D)) - - - - - - - - - - -
292 | Page CORPORATESERVICES-FUNDINGIMPACTSTATEMENT Fortheyearending30June ForecastDraftbudget Forecast Forecast Forecast Forecast Forecast Forecast Forecast Forecast Forecast 2024 2025 2026 2027 2028 2029 2030 2031 2032 2033 2034 $000 $000 $000 $000 $000 $000 $000 $000 $000 $000 $000 Sourcesofoperatingfunding Generalrates,uniformannualgeneralcharges, ratespenalties - - - - - - - - - -Targetedrates - - - - - - - - - -Subsidiesandgrantsforoperatingpurposes 11 11 11 11 12 12 12 12 13 13 13 Feesandcharges 1,436 1,685 1,723 1,762 1,803 1,842 1,881 1,919 1,957 1,994 2,032 InternalChargesandOverheadsRecovered - - - - - - - - - -Localauthoritiesfueltax,fines,infringement fees,andotherreceipts 3,842 4,811 3,563 3,627 3,694 3,774 3,866 3,926 3,993 4,113 4,204 Totaloperatingfunding(A) 5,289 6,507 5,297 5,400 5,509 5,628 5,759 5,857 5,963 6,120 6,249 Applicationsofoperatingfunding Paymentstostaffandsuppliers 25,673 28,765 27,694 28,163 27,357 27,841 28,359 28,300 28,051 28,393 28,512 Financecosts 3,550 3,778 4,706 3,541 3,650 3,705 3,905 3,970 4,096 4,157 4,240 Internalchargesandoverheadsapplied 17,757 4,976 (127) (2,538) (6,043) (9,943) (23,596) (31,365) (48,978) (68,100) (86,179) Otheroperatingfundingapplications - - - - - - - - - -Totalapplicationsofoperatingfunding(B) 46,980 37,519 32,273 29,166 24,964 21,603 8,668 905 (16,831) (35,550) (53,427) Surplus(deficit)ofoperatingfunding(A-B) (41,691) (31,012) (26,976) (23,766) (19,455) (15,975) (2,909) 4,952 22,794 41,670 59,676 Sourcesofcapitalfunding Subsidiesandgrantsforcapitalexpenditure - - - - - - - - - -Development&financialcontributions - - - - - - - - - -Increase(decrease)indebt 46,222 33,438 30,676 25,744 23,335 19,588 7,988 (1,824) (17,776) (37,612) (54,515) Grossproceedsfromsaleofassets 436 451 210 863 455 493 507 1,088 494 533 548 Lumpsumcontributions - - - - - - - - - -Otherdedicatedcapitalfunding - - - - - - - - - -Totalsourcesofcapitalfunding (C) 46,658 33,889 30,886 26,607 23,790 20,081 8,495 (736) (17,282) (37,079) (53,967) Applicationofcapitalfunding Capitalexpenditure -tomeetadditionaldemand - - - - - - - - - --toimprovelevelofservice 2,876 1,085 2,041 1,003 1,866 1,970 2,883 1,814 2,034 1,646 3,115 -toreplaceexistingassets 2,091 1,792 1,869 1,838 2,469 2,136 2,703 2,402 3,478 2,945 2,594 Increase(decrease)inreserves - - - - - - - - - -Increase(decrease)ofinvestments - - - - - - - - - -Totalapplicationsofcapitalfunding(D) 4,967 2,877 3,910 2,841 4,335 4,106 5,586 4,216 5,512 4,591 5,709 Surplus(deficit)ofcapitalfunding(C-D) 41,691 31,012 26,976 23,766 19,455 15,975 2,909 (4,952) (22,794) (41,670) (59,676) Fundingbalance((A-B)+(C-D)) - - - - - - - - - -WHOLEOFCOUNCIL-FUNDINGIMPACTSTATEMENT Fortheyearending30June ForecastDraftbudget Forecast Forecast Forecast Forecast Forecast Forecast Forecast Forecast Forecast 2024 2025 2026 2027 2028 2029 2030 2031 2032 2033 2034 $000 $000 $000 $000 $000 $000 $000 $000 $000 $000 $000 Sourcesofoperatingfunding Generalrates,uniformannualgeneralcharges, ratespenalties 94,916 111,720 123,275 136,989 146,135 159,854 181,320 197,216 218,912 240,015 261,015 Targetedrates 60,696 71,903 84,033 97,895 117,872 135,570 149,259 160,139 167,391 177,578 190,401 Subsidiesandgrantsforoperatingpurposes 9,218 12,152 12,455 12,764 13,051 13,370 13,680 13,796 14,072 14,340 14,615 Feesandcharges 58,637 69,303 74,177 76,717 79,378 81,402 83,609 85,767 87,688 89,726 91,737 Interest÷ndsfrominvestments 3,442 4,404 3,147 3,201 3,259 3,329 3,412 3,463 3,520 3,599 3,681 Localauthoritiesfueltax,fines,infringement fees,andotherreceipts 7,035 7,206 7,594 6,412 6,561 6,954 6,846 6,983 7,388 7,291 7,430 Totaloperatingfunding(A) 233,944 276,688 304,681 333,978 366,256 400,479 438,126 467,364 498,971 532,549 568,879 Applicationsofoperatingfunding (1) - 1 2 1 1 - (1) - 2 3 Paymentstostaffandsuppliers 203,690 221,717 223,889 229,446 235,246 241,103 246,072 251,195 256,122 261,261 264,670 Financecosts 18,631 28,027 33,576 40,707 45,989 51,523 57,341 59,644 60,566 61,078 60,173 Internalchargesandoverheadsapplied - - - - - - - - - -Otheroperatingfundingapplications - - - - - - - - - -Totalapplicationsofoperatingfunding(B) 222,321 249,744 257,465 270,153 281,235 292,626 303,413 310,839 316,688 322,339 324,843 Surplus(deficit)ofoperatingfunding(A-B) 11,623 26,944 47,216 63,825 85,021 107,853 134,713 156,525 182,283 210,210 244,036 Sourcesofcapitalfunding 1 2 (4) (2) (2) (3) 1 1 2 (2) (4) Subsidiesandgrantsforcapitalexpenditure 65,859 79,236 110,697 71,163 56,586 59,927 46,237 50,733 44,053 48,096 15,669 Development&financialcontributions 4,985 12,222 14,796 16,440 17,101 17,382 20,397 19,903 19,321 18,932 19,029 Increase(decrease)indebt 150,385 123,234 155,080 106,858 112,820 127,515 36,168 4,723 1,803 (32,021) (58,780) Grossproceedsfromsaleofassets 436 1,524 1,303 6,454 6,192 6,385 507 1,088 494 533 548 Lumpsumcontributions - - - - - - - - - -Otherdedicatedcapitalfunding - - - - - - - - - -Totalsourcesofcapitalfunding (C) 221,665 216,216 281,876 200,915 192,699 211,209 103,309 76,447 65,671 35,540 (23,534) Applicationofcapitalfunding Capitalexpenditure -tomeetadditionaldemand 12,711 51,765 83,375 76,713 76,328 59,714 31,463 22,688 15,230 10,841 15,391 -toimprovelevelofservice 129,100 110,558 119,753 75,060 117,923 155,839 89,157 91,022 107,933 50,241 68,698 -toreplaceexistingassets 91,477 80,837 125,964 112,967 83,469 103,509 117,402 119,262 124,791 184,668 136,413 Increase(decrease)inreserves - - - - - - - - - -Increase(decrease)ofinvestments - - - - - - - - - -Totalapplicationsofcapitalfunding(D) 233,288 243,160 329,092 264,740 277,720 319,062 238,022 232,972 247,954 245,750 220,502 Surplus(deficit)ofcapitalfunding(C-D) (11,623) (26,944) (47,216) (63,825) (85,021) (107,853) (134,713) (156,525) (182,283) (210,210) (244,036) Fundingbalance((A-B)+(C-D)) - - - - - - - - - - -
Fees and charges
The following is a consolidated list of Council’s fees and charges. All fees and charges include Goods and Services Tax (GST).
293 | Page
Animal Services Registration fees Registration type 2023/2024 Fee 2024/2025 Fee Entire dog - paid by 31 July $168.00 $174.00 Neutered dog - paid by 31 July $129.00 $133.00 Entire dog - paid after 31 July $223.00 $231.00 Neutered dog - paid after 31 July $184.00 $190.00 Responsible Dog Owner (RDO) status $84.00 $87.00 Responsible Dog Owner (RDO) status - paid after 31 July $223.00 $184.00 $231.00 (Entire) $190.00 (Neutered dog) Classified "Dangerous" dog - paid by 31 July $184.00 $190.00 Classified "Dangerous" dog - paid after 31 July $263.00 $272.00 Disability assist dogs Free Free Working dogs $84.00 $87.00 Working dogs (Secondary dogs) $40.00 $45.00 Impounding and SustenanceFees for Registered dogs Offence 2023/2024 Fee 2024/2025 Fee First impounding $108.00 $112.00 Second impounding in same registration year $173.00 $180.00 Daily sustenance fee (per day, per dog) $26.00 $27.00 After hours call out $44.00 $46.00 Seizure fee $87.00 $90.00 Impounding and SustenanceFees for Unregistered dogs Offence 2023/2024 Fee 2024/2025 Fee First impounding $130.00 $135.00 Second impounding in same registration year $216.00 $223.00 Daily sustenance fee (per day, per dog) $26.00 $27.00 After hours call out $44.00 $46.00 Seizure fee $130.00 $135.00
AdditionalServices
InfringementfeessetintheDogControlAct1996apply.
Archives
There is no charge for inspecting physical items on-site at Council offices. Please note: Researchers can use their own camera to take images when inspecting physical items on-site at Council offices.
Search Fees
For information ona topic where we searchthe Archives on your behalf
ReproductionFees
Reproductions are provided as high-quality, scanned images via email. Reproductions are subject tothe physicalcondition, type of itemand any copyright conditions.
294 | Page
Service 2023/2024 Fee 2024/2025 Fee Microchipping $44.00 $46.00 Replacement Registration Tag $13.00 $14.00 Responsible Dog Owner Property Inspection Administration Fee $70.00 $72.00 Dog Boarding (dangerous dogs/emergency situations only) $40.00 per day $42.00 per day Euthanasia at owner’s request - Up to 20 kg $185.00 $192.00 Euthanasia at owner’s request - 21 to 40 kg $230.00 $238.00 Euthanasia at owner’s request - 41 kg + $275.00 $285.00 Dog disposal/surrender fee (plus sustenance fee if required) $54.00 $56.00 Licence fee for keeping more than 2 dogs $70.00 $72.00 Requested dog pick-up/delivery $70.00 $72.00 After-hours collection fee (Dog disposal/surrender) $84.00 $90.00
Service 2023/2024
2024/2025
First hour of research Free of charge Free of charge For each additional half hour of staff time or part thereof $40.00 $40.00
charges
charges
Reproduction 2023/2024 charges 2024/2025 charges Scanning A3 and A4 - up to 20 pages Free of charge Free of charge Scanning A3 and A4 - over 20 pages $40.00 $40.00
Reproduction 2023/2024 charges 2024/2025 charges
Fee per half hour of staff time or part thereof
Reproduction of items larger than A3 are charged based on size, original format and physical condition.
Charges will be notified and agreed before reproduction is carried out. Charges will be notified and agreed before reproduction is carried out.
295 | Page
Boat sheds Description 2023/2024 charges 2024/2025 charges Boat shed Independent valuation on a square metre basis Independent valuation on a square metre basis Cemetery fees and charges Plotpurchaseandmaintenance Service 2023/2024 charges 2024/2025 charges Child (1 to 12 years) $798.00 $798.00 Infant (under 1 year) $176.00 $176.00 Ashes $715.00 $715.00 Ashes garden, Taitā and Wainuiomata $1,155.00 $1,155.00 Memorial tree plots, Block 18 $1,160.00 $1,160.00 Ponga trail, Block 19 $930.00 $930.00 Intermentfees Service 2023/2024 charges 2024/2025 charges Adult $968.00 $968.00 Child (1 to 12 years) $627.00 $627.00 Infant (under 1 year) $176.00 $176.00 Ashes $132.00 $132.00 RSA Veterans Service 2023/2024 charges 2024/2025 charges Burial plot purchase Free Free Burial interment fee $968.00 $968.00 Ashes plot purchase Free Free Ashes interment fee $132.00 $132.00 Ashes interment (memorial wall) $132.00 $132.00 Disinterments and re-interments Service 2023/2024 charges 2024/2025 charges Burial (body)* Price on enquiry Price on enquiry
Ashes**
Re-interments
Note: Re-interments are tobe charged as for interment fees.
Price on enquiry Price on enquiry
Price on enquiry Price on enquiry
Note:Reimbursement for unused plots is calculated at the rate originally paid for the plot.
*These figures are indicative only and the actualcost may differ depending on the nature of the disinterment.
**Applies toallplot purchases, where deceased has lived outside the city for the last five or more years.
Encroachment on Hutt City Council land
296 | Page Service 2023/2024
charges
charges 2024/2025
Special fees and charges Service 2023/2024 charges 2024/2025 charges Outside district fees** $1,298.00 $1,298.00 Outside district fee children under 12** $1,138.00 $1,138.00 Outside district fee RSA** $1,298.00 $1,298.00 Outside district fee ashes** $930.00 $930.00 Casket larger than standard $286.00 $286.00 Extra depth (90cm) $231.00 $231.00 Weekend interment - casket $495.00 $495.00 Weekend interment - ashes $242.00 $242.00 Plaque/Memorial fees $97.00 $97.00 Plot cancellation fee $63.00 $63.00 Transfer of exclusive right $63.00 $63.00 Breaking of concrete Actual cost Actual cost Search fee: Per entry (up to 30 minutes) $29.00 $29.00
Service 2023/2024 charges 2024/2025 charges Application fee (new applications) $324.00 $335.00 Application fee (alterations to existing use) $324.00 $335.00 Change to current licence holder $108.00 $111.70 Gardens $124.00 $128.20 Garage (per car park) $139.00 $143.75
Assessed by Council at a market rate Assessed by Council at a market rate
Note:Council is currently reviewing its Encroachment Policy, including the annual licence fees. The fees noted above for gardens, garage (per car park), drainage reserve, and pavement are the current fees. Council reserves the right toalter the licence scope and fee inlink with any future Encroachment Policy adopted by Council
297 | Page Service 2023/2024 charges 2024/2025 charges Drainage reserve $62.00 $64.10 Pavement $62.00 $64.10 Commercial
Engineering records and land information services Print Size/Service 2023/2024 charges 2024/2025 charges A0 $6.00 - 80 gsm bond $9.00 - 95 gsm coated $6.00 - 80 gsm bond $9.00 - 95 gsm coated A1 $3.00 - 80 gsm bond $5.00 - 95 gsm coated $6.00 - 80 gsm bond $9.00 - 95 gsm coated A2 $2.00 - 80 gsm bond $3.00 - 95 gsm coated $2.00 - 80 gsm bond $3.00 - 95 gsm coated A3 $1.30 - 80 gsm bond $1.40 - 95 gsm coated $1.30 - 80 gsm bond $1.40 - 95 gsm coated A4 $1.00 - 80 gsm bond $1.00 - 95 gsm coated $1.30 - 80 gsm bond $1.40 - 95 gsm coated Geospatial team - hourly rate $79.00 per hour $79.00 per hour Resourceconsents
All fees include GST and are payable under section 36 of the Resource Management Act 1991.
Our fees are divided into three parts and will be invoiced in stages.
• Application Deposit
• Intermediate Invoices
• Final Invoice
TheresourceconsentApplicationDepositcoversonlypartthecostofprocessing yourapplicationandisadepositforworkthatwilltakeplace.
MonthlyIntermediateInvoicesaresentifyourapplicationisapprovedandcover feesfor:
• additionalprocessingfees
• consultants’,advisors’andspecialists’feescoveringarangeofexpertisee.g. heritage,geotechnical,ecological,noisecontrol,trafficmanagementetc
• Costsrelatedtopublicnotificationandhearings,suchasvenuehire, photocopying,cateringandpostage
• monitoringfeeswhiletheworkisunderway,includingsitevisits,research, photos,communicationsandadministration
TheFinalInvoicetakesintoaccountthedepositalreadypaid,anyfurtherpayments fortheservicesmentionedaboveandanydiscountsowedtoyou.
Consentsthatrunoverstatutorytimeframeswillbediscountedinaccordancewith provisionsinSection36AAoftheResourceManagementAct.
298 | Page
Non-complying,discretionary,restricteddiscretionaryandcontrolled applications Application type 2023-2024 Processing & Administratio n 2023-2024 Fee 2024-2025 Processing & Administratio n 2024-2025 Fee Pre-application meetings $220 per hour with Resource Consents planner or manager of planning $150 per hour with business support including $230 per hour with planner, engineer or monitoring officer $150 per hour with business support including administration
Application type
Notified applicationhearing required
2023-2024
Processing & Administratio n
Processing: up to 50 hours
2023-2024 Fee
Limited notification Processing: up to 35 hours
Business
Support: 1 hour
Monitoring : 1 hour
Non-notified
Non-notified
Processing: up to 9 hours
Business
Support: 1 hour
Monitoring : 1 hour
Processing: up to 5 hours
Business
Support: 1 hour
Monitoring : 1 hour
Boundary
up to 3 hours
2024-2025
2024-2025 Fee administration and planning technician time
Processing & Administratio n
Consultants charged at actual cost and planning technician time
$11,000.00
Additional fee of $1,000.00 for applications requiring notification in a daily newspaper
Processing: up to 50 hours
Consultants charged at actual cost
$11,500.00
Additional fee of $1,000.00 for applications requiring notification in a daily newspaper
$7,920.00 Processing: up to 35 hours
Business Support: 1 hour
Monitoring : 1 hour $8,430.00
$2,350.00 Processing: up to 9 hours
Business Support: 1 hour
Monitoring : 1 hour $2,450.00
$1,470.00 Processing: up to 7 hours
Business
Support: 1 hour
Monitoring : 1 hour $1,990.00
$810.00 Processing: up to 3 hours $840.00
299 | Page
resource consent
resource consentresidential additions and alterations
deemed
Processing:
All
or monitoring time by planner, engineer, or monitoring officer
Hearing commissioner time shall be recovered for time spent in hearings and deliberating
Council Commissioners :
Chair: $116.00 per hour
Members: $93.00 per hour
Independent Commissioners :
Chair: Actual Cost Member of hearing panel: Actual Cost
up to 3 hours Business Support: 1 hour $840.00
Council Commissioners :
Chair: $116.00 per hour
Members: $93.00 per hour
Independent Commissioners :
Chair: Actual Cost
Member of hearing panel: Actual Cost
300 | Page Application type
Processing & Administratio n 2023-2024 Fee
Processing & Administratio n
permitted
2023-2024
2024-2025
2024-2025 Fee
activities Business Support: 1 hour Business Support: 1 hour Marginal or temporary activity exemptions Processing: up to 3 hours Business Support: 1 hour $810.00 Processing:
$220.00
$230.00
additional processing
per hour
per hour
$150.00 per
$150.00
All additional business support time
hour
per hour
Fast Tracknon-notified consents onlyissued within 10 Two times the normal fee Additional processing Two times the normal fee Additional processing
Note: condition s apply, applications will be accepted on a
Fast Tracknon-notified consents onlyissued within 5 days
Note: condition s apply, applications will be accepted on a case-by-case basis
301 | Page Application type 2023-2024 Processing & Administratio n 2023-2024 Fee 2024-2025 Processing & Administratio n 2024-2025 Fee days
basis time: $440.00 per hour time: $460.00 per hour
case-by-case
the normal fee Additional processing time: $660.00 per hour
Three times
normal
Additional processing time: $690.00 per hour Subdivisions(includingunittitleandcrosslease) Application type 2023-2024 Processing & Administratio n 2023-2024 Fee 2024-2025 Processing & Administratio n 2024-2025 Fee Preapplication meeting $220 per hour with planner, engineer or monitoring officer $150 per hour with business support including administration $230 per hour with planner, engineer or monitoring officer $150 per hour with business support including administration
Three times the
fee
Application type
2023-2024
Processing & Administratio n
Notified applicationhearing required
Processing: up to 50 hours at the senior rate
2023-2024 Fee
Limited notification Processing: Up to 35 hours
Monitoring: 1 hour
Subdivision
Subdivision
Processing: Up to 17 hours
Business
Support: 1 hour
Monitoring: 1 hour
Processing: Up to 27 hours
Business
Support: 1 hour
Monitoring: 1 hour
Subdivision consent Processing: Up to 13 hours
Business
Support: 1 hour
2024-2025
2024-2025 Fee and planning technician time
Processing & Administratio n
Consultants charged at actual cost and planning technician time
$11,000.00
Additional fee of $1,000.00 for applications requiring notification in a daily newspaper
Processing: up to 50 hours
$7,920.00 Processing: Up to 35 hours
Consultants charged at actual cos
$11,500.00
Additional fee of $1,000.00 for applications requiring notification in a daily newspaper
Monitoring: 1 hour $8,280.00
$4,110.00 Processing: Up to 17 hours
Business Support: 1 hour
Monitoring: 1 hour $4,290.00
$6,310.00 Processing: Up to 27 hours
Business
Support: 1 hour
Monitoring: 1 hour $6,590.00
$3,230.00 Processing: Up to 13 hours
Business Support: 1 hour $3,370.00
302 | Page
consent including land use consent for up
to three lots
consent including land use consent for four or
lots
more
303 | Page Application type 2023-2024 Processing & Administratio n 2023-2024 Fee 2024-2025 Processing & Administratio n 2024-2025 Fee Monitoring: 1 hour Monitoring: 1 hour Certificate under section 223 and/or 224 of the RMA Processing & Administration: Up to 3 hours Business Support: 1 hour $810.00 Processing & Administration: Up to 3 hours Business Support: 1 hour $840.00 Certificate under section 226 of the RMA Processing: Up to 6 hours Business Support: 1 hour $1,470.00 Processing: Up to 6 hours Business Support: 1 hour $1,530.00 Section 241 and 243 RMA application Processing: Up to 6 hours Business Support: 1 hour $1,470.00 Processing: Up to 6 hours Business Support: 1 hour $1,530.00 Rights of way Processing: Up to 6 hours Business Support: 1 hour $1,470.00 Processing: Up to 6 hours Business Support: 1 hour $1,530.00 Rights of way sealing fee Processing: Up to 2 hours Business Support: 1 hour $440.00 Processing: Up to 2 hours Business Support: 1 hour $460.00 All additional processing or monitoring time by planner, engineer or monitoring officer $220.00 per hour $230.00 per hour All additional business support time $150.00 per hour $150.00 per hour Hearing commissione Council Commissioners Council Commissioners
Chair: $116.00 per hour
Members: $93.00 per hour
r time shall be recovered for time spent in hearings and deliberating :
Independent Commissioners :
Chair: Actual Cost
Member of hearing panel:
:
Chair: $116.00 per hour
Members: $93.00 per hour
Independent Commissioners :
Chair: Actual Cost
Member of hearing panel:
304 | Page Application type
Processing & Administratio
2023-2024 Fee
Administratio
Fee
2023-2024
n
2024-2025 Processing &
n 2024-2025
Actual Cost
Actual Cost OtherFees Application type
Processing & Administration 2023-2024 Fee
Processing & Administration
Fee Sec 139A Existing Use Certificate application Processing: Up to 6 hours Business Support: 1 hour $1,470.00 Processing: Up to 6 hours Business Support: 1 hour $1,530.00 Certificate of Compliance Processing: Up to 6 hours Business Support: 1 hour $1,470.00 Processing: Up to 6 hours Business Support: 1 hour $1,530.00 Outline plan or waiver Processing: Up to 6 hours Business Support: 1 hour Monitoring: 1 inspection $1,470.00 Processing: Up to 6 hours Business Support: 1 hour Monitoring: 1 inspection $1,530.00 Section 10 waiver, section 37 waiver, section 125 Processing: Up to 6 hours Business Support: 1 hour $1,470.00 Processing: Up to 6 hours Business Support: 1 hour $1,530.00
2023-2024
2024-2025
2024-2025
305 | Page Application type 2023-2024 Processing & Administration 2023-2024 Fee 2024-2025 Processing & Administration 2024-2025 Fee extension, section 126 cancellation, sections 127 & 128 review (non-notified) RMA Certificate of Use under the Sale and Supply of Alcohol Act 2012 Business Support: Up to 2 hours $300.00 Business Support: Up to 2 hours $300.00 Sealing fee (for urgent applications for registrable instruments) $220.00 $230.00 Certificate under Overseas Investment Act 1973 Processing: Up to 3 hours $660.00 Processing: Up to 3 hours $690.00 Cost of disbursements i.e. venue hire, photocopying, catering, postage, public notification Actual cost Actual cost Independent consultants, advisors, specialists Actual cost invoiced monthly Actual cost invoiced monthly Discharge or withdrawal of registrable instruments Legal costs: Actual cost Officer's time: Legal costs: Actual cost Officer's time:
306 | Page Application type 2023-2024 Processing & Administration 2023-2024 Fee 2024-2025 Processing & Administration 2024-2025 Fee $220.00 per hour $230.00 per hour Processing request for removal of building line Processing: Up to 1 hour $220.00 Additional time: $220.00 per hour Disbursements: Actual cost Processing: Up to 1 hour $230.00 Additional time: $230.00 per hour
Actual cost
variation or revocation of easements
costs: Actual cost Officer's time: $220.00 per hour Legal costs: Actual cost Officer's time: $230.00 per hour Bond preparation and/or
Processing: 2 hours by senior/team leader $440.00 Additional time: $220.00 per hour Disbursements: Actual cost Processing: 2 hours $460.00 Additional time: $230.00 per hour Disbursements: Actual cost EnvironmentalSustainabilityInitiatives Initiative Processing & Inspections included 2023-2024 Fees Processing & Inspections included 2024-2025 Fee Eco Design Advisor home assessment & advice 2 hours Free Free Advice on building to Home Star or PassiveHouse requirements 2 hours $1,500.00 Additional time: $180.00 per hour Free Additional time: $180.00 per hour
Disbursements:
Approval,
Legal
release
Consents for:
• Domestic solar hot water heating panels
• Solar water heating systems
• Hot water heat pump systems
• Hot water systems, i.e. wetbacks associated with wood pellet stoves or low-emission wood burners First
and
for the category of consent will apply
charges for the category of consent will apply All
Resourceconsenttermsandlatepayment
Initialand additionalfees
Feesmustbepaidbeforeapplicationsareprocessedandworkundertakenby Council.Furtherchargeswillbeinvoicedifadditionaltimeisspentprocessing requestsand/ordisbursements.
Terms of payment
Paymentofadditionalfeesisduebythe20thofthemonthfollowinginvoice processing.
Latepaymentwillincur:
• an additional administrative fee (lesser than 10% of the overdue amount or $300.00)
• allcostsandexpenses(includingdebtcollectionorlegalfees)associated withrecoveryoftheoverdueamount.
307 | Page Initiative Processing & Inspections included 2023-2024 Fees Processing & Inspections included 2024-2025 Fee
5 hours processing 1 monitoring inspection Free Additional time
time
additional monitoring inspections $180.00 per hour $180.00 per hour
and inspections: standard charges
Free Additional
inspections: standard
Building consents
ApplicationFees
Ourapplicationfeescoverourinitialadministrationandprocessingtimeandthe specifiednumberofinspections.
OurapplicationfeesincludeGST.
Theydon’tinclude:
• additionaladministration,processingandinspectionfees
• disbursementcosts
• consultants’fees(atcost)
• theBRANZlevy($1per$1,000forworksvaluedat$20,000andover)SUBJECT TOCHANGE
• theMinistryofBusiness,InnovationandEmploymentlevy($1.75per$1,000for worksvaluedat$20,444andover).NOTETHESEAREUNDERREVIEWBYMBIE CURRENTLYsubjecttochange
We’llletyouknowthedetailsoftheseadditionalfeesoncetheapplicationprocessis complete.
Buildingconsentfeeslistforthefinancialyears2022-2023and2023-2024
HardcopyConsents
Yourapprovedconsentswillbesentelectronicallyunlessyourequestahardcopy. Additionalfeeswillapplyinthefollowingsituations:
• Consent applications submitted in hardcopy
• Hardcopy issued of approved Minor Works Consent
• Hardcopy issued of approved Residential Consent
• Hardcopy issued of approved Commercial Consent
308 | Page
BuildingConsentApplications Application Type 2023-2024 Processing & Inspections included 2023-2024 Fees 2024-2025 Processing & Inspections included 2024-2025 Fees Preapplication meetings Residential: $195.00 per hour Commercial: $220.00 per hour Residential: $230.00 per hour Commercial: $250.00 per hour Digital lodgement fee $50.00 Not charged for Free standing and inbuilt wood burners, minor Residential: $100.00 (below
Application Type
2023-2024 Processing & Inspections included
Free standing and Inbuilt fire
Fast Trackfive days up to 1 hour processing, 0.5 hours admin and 1 hour inspection time
Minor works (minor drainage) up to 1.5 hours processing, 0.5 hours admin and 2 hours inspection time
2023-2024 Fees
2024-2025 Processing & Inspections included 2024-2025 Fees works building consents, schedule 1 exemptions, extension of time requests and code compliance certificates applications
$500,000 value of work)
$175.00 (incl and above $500,000 value of work)
Commercial: $250.00 (below $500,000 value of work)
$500.00 (incl and above $500,000 value of work)
Residential: $465.00
Commercial: $515.00 1.5 hours processing,1 hour inspection time and 0.5 hour administration time
Residential $657.50 Commercial $707.50
Residential: $757.50
Commercial: $845.00 up to 2 hours processing, 0.5 hours admin and 2 hours inspection time
Residential $1,002.50 Commercial $1,082.50
309 | Page
Application Type
2023-2024 Processing & Inspections included
< $5000 up to 3 hours processing, 0.5 hours admin and 2 hours inspection time
To $10,000 up to 5 hours processing, 0.5 hours admin and 2 hours inspection time
To $19,999 up to 5.5 hours processing, 1.5 hours admin and 3 hours inspection time
To $50,000 up to 7 hours processing, 1.5 hours admin and 4 hours inspection time
To $100,000 up to 8 hours processing, 1.5 hours admin and 5 hours inspection time
To $200,000 up to 10 hours processing, 1.5 hours admin
2023-2024 Fees
Residential: $1,050.00
2024-2025 Processing & Inspections included 2024-2025 Fees
Commercial: $1,175.00 up to 3 hours processing, 0.5 hours admin and 2 hours inspection time
Residential $1,232.5 Commercial $1,332.5
Residential: $1,440.00
Commercial: $1,615.00 up to 5 hours processing, 1 hour admin and 2 hours inspection time
Residential: $1,882.50
Commercial: $2,095.00 up to 5.5 hours processing, 1.5 hours admin and 3 hours inspection time
Residential $1,775.00
Commercial $1,915.00
Residential $2,202.50
Commercial $2,372.50
Residential: $2,370.00
Commercial: $2,645.00 up to 7 hours processing, 1.5 hours admin and 4 hours inspection time
Residential: $2,760.00
Commercial: $3,085.00 Up to 8 hours processing, 1.5 hours admin and 5 hours inspection time
Residential $2,777.50 Commercial $2,997.50
Residential $3,237.50
Commercial $3,437.50
Residential: $3,345.00 Up to 10 hours processing, 1.5 hours
Residential $3,927.50
310 | Page
2023-2024 Processing & Inspections included
and 6 hours inspection time
To $300,000 up to 11 hours processing, 1.5 hours admin and 7 hours inspection time
To $500,000 up to 12 hours processing, 2.5 hours admin and 8 hours inspection time
To $1,000,000 up to 16 hours processing, 2.5 hours admin and 8 hours inspection time
To $2,000,000 up to 20 hours processing, 2.5 hours admin and 9 hours inspection time
Over $2,000,000 up to 22 hours processing, 3 hours admin and 10 hours inspection time
2023-2024 Fees
2024-2025 Processing & Inspections included 2024-2025 Fees
Commercial: $3,745.00 admin and 6 hours inspection time
Residential: $3,735.00
Commercial: $4,185.00 Up to 11 hours processing, 1.5 hours admin and 7 hours inspection time
Residential: $4,275.00
Commercial: $4,775.00 Up to 12 hours processing, 2.5 hours admin and 8 hours inspection time
Residential: $5,055.00
Commercial: $5,665.00 up to 16 hours processing, 2.5 hours admin and 8 hours inspection time
Residential: $6,030.00
Commercial: $6,775.00 Up to 20 hours processing, 2.5 hours admin and 9 hours inspection time
Residential: $6,690.00
Commercial: $7,415.00 Up to 22 hours processing, 3 hours admin and 10 hours inspection time
Commercial $4,247.50
Residential $4,387.50
Commercial $4,747.50
Residential $5,012.50
Commercial $5,412.50
Residential $5,932.50
Commercial $6,412.50
Residential $7,082.50
Commercial $7,662.50
Residential $7,855.00
Commercial $8,495.00
311 | Page
Application Type
Schedule 1
exemptionminor works including exemption for blown insulation up to 1 hour processing and 1 hour admin
Residential: $345.00
Additional time: $195.00 per hour
Commercial: $370.00
Additional time: $220.00 per hour
Up to 1 hour processing and 1 hour admin
Residential: $395.00
Additional time: $230.00 per hour
Commercial: $415.00
Additional time: $250.00 per hour
Schedule 1 exemption - all others up to 4 hours processing and 1 hour admin
Certificate for Public Use up to 2 hours processing, 1 hour admin and 1 hour inspection time
Residential: $930.00
Additional time: $195.00 per hour
Commercial: $1,030.00
Additional time: $220.00 per hour
Residential: $735.00
Additional time: $195.00 per hour
Commercial $810.00
Additional time: $220.00 per hour
Up to 4 hours processing and 1 hour admin
Fast Trackprocessed
Two times application
up to 2 hours processing, 1 hour admin and 1 hour inspection time
Residential: $1,085.00
Additional time: $230.00 per hour
Commercial: $1,165.00
Additional time: $250.00 per hour
Residential: $855.00
Additional time: $230.00 per hour
Commercial $915.00
Additional time: $250.00 per hour
Two times application
312 | Page
& Inspections included
&
2024-2025
Application Type 2023-2024 Processing
2023-2024 Fees 2024-2025 Processing
Inspections included
Fees
Application
within 10 working days (conditions applyapplications will be accepted on a case-by-case basis only)
Extension of time
Notice to fix
fee
Additional time:
Residential: $390.00 per hour
Commercial: $440.00 per hour
Residential: $292.50
Commercial: $330.00
Residential: $195.00
Additional time: $195.00 per hour
Commercial: $220.00
Additional time: $220.00 per hour
2024-2025 Processing & Inspections included 2024-2025 Fees
fee
Additional time:
Residential: $460.00 per hour
Commercial: $500.00 per hour
Residential: $460.00
Commercial: $500.00
Residential: $230.00
Additional time: $230.00 per hour
Commercial: $250.00
Additional time: $250.00 per hour
Owner supplied information $195.00 per hour $230.00 per hour
PIM up to 2 hours processing and 1 hour admin
Residential: $540.00
Additional time: $195.00 per hour up to 2 hours processing and 1 hour admin
Residential: $625.00
Additional time: $230.00 per hour
313 | Page
Type 2023-2024 Processing & Inspections included 2023-2024 Fees
Building Consent fee terms and latepayment
InitialFeesandAdditionalFees
Initialfees canbe paid anytime fromthe invoice being received and must be paid before approved applications are issued by Council. The processing of your applicationwillcontinue whenyoureceive the invoice. Further charges willbe invoiced for disbursements and if additional timeisspentprocessingthe application.
TermsofPayment
Payment of additionalconsenting,administration,disbursementsand consultants’ fees shallbe paid before applicationis issued. Additional inspectionfeesshallbe paidbeforeCodeComplianceCertificateisissued.
Late paymentwillincur:
• an additional administrativefee-lesserof10%oftheoverdueamountor $357.50
• allcostsandexpenses(includingdebtcollectionorlegalfees)associated withrecoveryoftheoverdueamount. Other
Code
Residential: $195.00
Commercial:
Residential: $510 (includes 1.5 hours of processing, 1 hour of administration)
314 | Page Application Type 2023-2024 Processing & Inspections included 2023-2024 Fees 2024-2025 Processing & Inspections included 2024-2025 Fees Commercial: $590.00 Additional time: $220.00 per hour Commercial: $665.00 Additional time: $250.00 per hour
Fees Feetype 2023-2024 Fees 2024-2025 Fees Restricted Building Work (for works $20,000 and over) $97.50 $115.00 BCA Accreditation Levy (for works $20,000 and over) Residential: $55.00 Commercial: $75.00
$65.00 Commercial: $80.00
Residential:
Compliance Certificate (Application Fee for all building work included in an issued building consent)
$220.00
Feetype
2023-2024 Fees 2024-2025 Fees
Additional time: $230 per hour
Commercial: $1,040 (includes 3.5 hours of processing, 1 hour of administration)
Additional time: $250 per hour
All additional processing and admin (per hour) - except where a different rate is listed
Building inspections –minimum charge of 1 hour per inspection
Admin only: $150.00
Residential: $195.00
Commercial: $220.00
Residential: $195.00
Commercial: $220.00
Admin only: $165.00
Residential: $230.00
Commercial: $250.00
Residential: $230.00
Additional time: $230 per hour
Commercial: $250.00
Additional time: $250 per hour
Amendment to building consent including B2 durability modification
72
Residential: $540.00 (includes 2 hours processing and 1 hour admin)
Additional time: $195.00 per hour
Commercial: $590.00 (includes 2 hours processing and 1 hour admin)
Additional time: $220.00 per hour
Residential: actual cost
Commercial: actual cost
(Processing time covered in initial fee)
Residential: $625 (includes 2 hours processing and 1 hour admin)
Additional time: $230.00 per hour
Commercial: $665 (includes 2 hours processing and 1 hour admin)
Additional time: $250.00 per hour
Residential: actual cost
Commercial: actual cost
315 | Page
Section
- building on land subject to natural hazards
Section 75 - building on two or more allotments
2023-2024 Fees 2024-2025 Fees
(Processing time covered in initial fee)
Residential: actual cost
Commercial: actual cost
(Processing time covered in initial fee)
Works under $100,000 $1,200.00 + normal building consent fee + levies for MBIE
Additional time:
Residential: $195.00 per hour
Commercial: $220.00 per hour
Additional processing time will be charged at the end of the process
Residential: actual cost
Commercial: actual cost (Processing time covered in initial fee)
Works $100,000 and over $3,500.00 + normal building consent fee + levies for MBIE
Additional time:
Residential: $195.00 per hour
Commercial: $220.00 per hour
Additional processing time will be charged at the end of the process
$1,300.00 and normal building consent fee and any levies required e.g. For MBIE
Additional time:
Residential: $230.00 per hour
Commercial: $250.00 per hour
Additional processing time will be charged at the end of the process
$3,800.00 and normal building consent fee and any levies required e.g. For MBIE
Additional time:
Residential: $230.00 per hour
Commercial: $250.00 per hour
Additional processing time will be charged at the end of the process
316 | Page Feetype
Structural checking fee Actual cost Actual cost CertificateofAcceptance(COA) Valueof works 2023-2024 Fees 2024-2025 Fees
BuildingWarrantofFitnessfeeterms
RegistrationfeesmustbepaidbetweentheBuildingWarrantofFitnessrenewaldate andthe20thofthefollowingmonth.
LatePayments
Ifpaymentisnotreceivedbythe20thofthemonthfollowingtherenewaldateof yourBuildingWarrantofFitness,thefollowing willapply:
• an additional administrativefee-lesserof10%oftheoverdueamountor $357.50
• allcostsandexpenses(includingdebtcollectionorlegalfees)associated withrecoveryoftheoverdueamount.
317 | Page ComplianceSchedule(CS)&BuildingWarrantofFitness
Feetype 2023-24 Processing included 2023-2024 Fees 2024-25 Processing included 2024-2025 Fees BWOF Registration: 1-2 specified systems 0.5 hours $97.50 0.5 hours $115.00 BWOF Registration: 3-8 specified systems 1 hour $195.00 1 hour $250.00 BWOF Registration: 9 or more specified systems 1.5 hours $292.50 2 hours $500.00 BWOF/CS audit $195.00 per hour $250.00 per hour New CS or Amendment to CS 1 hour $220.00 Additional time: $220.00 per hour $250.00 per hour Notice to fix 1 hour $195.00 $230.00 per hour residential $250.00 per hour commercial Residential cable car 0.5 hours $97.50 $115 per hour Additional timeexcept where a different rate is listed $195.00 per hour $250.00 per hour
(BWOF)
BuildingWarrantofFitnessInspectionfeeterms
Termsofpayment
Paymenttobemadebeforethe20thofthefollowingmonth.
Latepayment
Ifpaymentisnotreceivedbythe20thofthemonthfollowing,thefollowingwillapply:
• an additional administrativefee-lesserof10%oftheoverdueamountor $357.50
• allcostsandexpenses(includingdebtcollectionorlegalfees)associated withrecoveryoftheoverdueamount.
318 | Page
EarthquakeProneBuildings Feetype 2023-24 Processing time included 2023-2024 Fees 2024-2025 Fees Issuing Earthquake Prone Building Notice 1 hour $195.00 $250 per hour Extension of time 1 hour $195.00 $250.00 per hour Exemption 1 hour $195.00 $250.00 per hour Additional time $195.00 per hour $250.00 per hour Earthquake prone building on MBIE register $195.00 per building $250.00 per building ResidentialPools Feetype 2023-2024 Fees 2024-2025 Fees Pool audit inspection $195.00 $230 per hour Pool re-inspection $97.50 $115 per hour Pools receipt of IQPI report $97.50 (first 0.5 hour) Additional time: $195.00 per hour $115 (first 0.5 hour) Additional time: $230.00 per hour Applications for waivers under section 67A of the Building Act. $360.00 Additional time: $180.00 per hour $400.00 Additional time: $230.00 per hour Notice to fix $195.00 (first hour) Additional time: $195.00 per hour $230.00 per hour
Pools late payment terms
Ifpaymentisnotreceivedbythe20thofthemonthfollowingthedateoftheinvoice, thefollowingwillapply:
• an additional administrativefee-lesserof10%oftheoverdueamountor $357.50
• allcostsandexpenses(includingdebtcollectionorlegalfees)associated withrecoveryoftheoverdueamount.
Hardcopylodgementsanddocumentsissuedforconsent
Hardcopy lodgement fee
Excludes: Freestanding and Inbuilt fires, and Exemptions
Minor Works Consent (hardcopy)
Residential: $97.50 Commercial: $110.00
Residential: $75.00
Commercial: $75.00
Residential: $460.00
Commercial: $500.00
Residential: $345.00
Commercial: $375.00
Residential Consent (hardcopy)processing $150.00 $230.00 per hour
Commercial Consent (hardcopy)processing $150.00 (first hour)
Additional time: $150.00 per hour $250.00 per hour
ApplicationFeeRefunds
Youcanwithdrawyourbuildingconsentapplicationbeforeithasbeengrantedby Council.
Ifyouwithdraworcancelyourapplication,anyrefundwillreflectthetimeourteam havealreadyspentprocessingit.
319 | Page
Feetype 2023-2024 Fees 2024-2025 Fees
Buildinginformation Service 2023-2024 Fee 2024-2025 Fee Approved building permit and building consent information Available free on our website Available free on our website Request for building information sent by mail First 30 minutes free Additional time: First 30 minutes free
Request for building information hard copy $1.65 per A4
Plumbing and drainage plan
Aerial
AllfeesincludeGST.
feeincludes 8 hours processing time)
Fast Track – residential only, processed within five working days (conditions apply, applications will be accepted on a caseby-case basis)
Completed LIM
Your LIM will be sent electronically. A fee will apply if a hard copy is requested.
Available free on our website
Available free on our website
LIM/Property Information terms and latepayment
Initial fees and additional fees
per A3 $2.15 per A4
per A3
Available free on our website
Available free on our website
Fees must be paid before applications are processed and work is undertakenby Council.
If your application is withdrawn a refund maybe given based on the amount of time already spent processing the LIM.
320 | Page Service 2023-2024 Fee 2024-2025 Fee $97.50 per half hour Additional time $115.00
per half hour
$2.75
$3.50
photography
A4 colour aerial photo $1.65 $4.50 A3 colour aerial photo $1.65 $7.50 Certificate of Title $27.50 $35.00 Interests/document e.g. transfer, easement, covenant, lease $24.00 $31.50 LIMS
Service 2023-2024 Fee 2024-2025 Fee Residential property LIM $400.00 $475.00 Commercial property LIM (base
$700.00 $1,250.00 Additional processing (per hour) $195.00 $205.00
$550.00 when available $800.00 when available
Hardcopy
$60.00
LIM
$60.00
Charges for commercial LIMs where additionaltime is spent processing the application willbe invoiced
Terms of payment
Late paymentwillincur:
• an additional administrativefee(10%oftheoverdueamount)
• allcostsandexpenses(includingdebtcollectionorlegalfees)associated withrecoveryoftheoverdueamount.
Full details of the development contributions charges and their makeup can be found in the Council’s Development and Financial Contributions Policy which is updated through each Annual/Long-term planning cycle and consulted on where significant changes to the policy are made.
health
Application for registration of Food Control Plan (FCP) based on a template or model issued by MPI
Application for registration of a business subject to a plan or model for National Programmes
$375.00 (includes 2 hours processing) $390.00 (includes 2 hours processing)
$375.00 (includes 2 hours processing) $390.00 (includes 2 hours processing)
Application for renewal of registration $185.00 (includes 1 hour processing) $195.00 (includes 1 hour processing)
Application for amendment to registration $185.00 (includes 1 hour processing) $195.00 (includes 1 hour processing)
Significant amendment to Food Control Plan $185.00 (includes 1 hour processing) $195.00 (includes 1 hour processing)
Additional time $185.00 per hour $195.00 per hour
321 | Page
Development Contributions Service 2023-2024 Fee 2024-2025 Fee Reconsideration Fee $400.00 $400.00 Objection Deposit $3,000.00 $3,000.00
Environmental
Food Act 2014 Registration 2023/2024 Fee 2024/2025 Fee
Verification of a Food Control Plan (FCP) based on a template or model issued by MPI
Verification of a plan or model for National Programme 3 (NP3)
Verification of a plan or model for National Programme 2 or 1
Cancellation of a verification within 3 days without acceptable reason
Inability to verify an FCP or National Programme at the scheduled time, or to carry out the verification due to the absence of key personnel, or the FCP, or records not being available
$185.00 per hour for all verification activities, including travel time.
$185.00 per hour for all verification activities, including travel time.
$185.00 per hour for all verification activities, including travel time.
$195.00 per hour for all verification activities, including travel time.
$195.00 per hour for all verification activities, including travel time.
$195.00 per hour for all verification activities, including travel time.
$185.00 in addition to any time spent, at $185.00 per hour
$195.00 in addition to any time spent, at $195.00 per hour
322 | Page Food Act 2014 Verification 2023/2024 Fee 2024/2025 Fee
$185.00 $195.00
Food Act 2014 Compliance 2023/2024 Fee 2023/2024 Timing of Payment 2024/2025 Fee 2024/2025 Timing of Payment Issue of Improvement Notice or Notice of Direction $185.00 per hour of activity Payable on invoice $195.00 per hour of activity Payable on invoice Application for review of issue if Improvement Notice or Notice of Direction $185.00 per hour of activity $185.00 payable on application Remainder payable on invoice $195.00 per hour of activity $195.00 payable on application Remainder payable on invoice
All other services and compliance/monitoring activities for which a fee may be set under the Food Act. This includes follow up visits to close out corrective actions, review of (successful) appeals/submissions to verification outcomes, surrender, suspension and revocation of registration.
323 | Page Food Act 2014 Compliance 2023/2024 Fee 2023/2024 Timing of Payment 2024/2025 Fee 2024/2025 Timing of Payment
$185.00 per hour of activity Payable on invoice $195.00 per hour of activity Payable on invoice Additional Fees 2023/2024 Fee 2024/2025 Fee FCP template and record blanks (photocopy and bound) $35.00 $35.00 Replacement diary (photocopy and bound) $35.00 $35.00 NP guidance and record blanks (photocopy and bound) $35.00 $35.00 Thermometer $35.00 $35.00 Change of ownership (non-food premises) $185.00 $195.00 General administration fee $185.00 per hour $195.00 per hour Hardcopy application fee where no online/electronic option is available $85.00 $90.00 Amusement devices (temporary approval) 2023/2024 Fee 2024/2025 Fee For one device, for the first 7 days of proposed operation or part thereof $11.50 $11.50 For each additional device operated by the same owner, for the first 7 days or part thereof $2.30 $2.30
For each device, for each further period of 7 days or part thereof
Registration fee for an Appearance Industry application
Registration fee for a combined Hairdresser/Appearance Industry application
Additional time for registration/inspection and investigation of justified complaints under the Appearance Industries Bylaw
$275.00 (which includes up to 1.5 hour of inspection, administration, and travel time)
$370.00 (which includes up to two hours of inspection, administration, and travel time
$290.00 (which includes up to 1.5 hour of inspection, administration, and travel time)
$390.00 (which includes up to two hours of inspection, administration, and travel time
Seizure fine (stereo equipment)
Subsequent seizures (stereo equipment) within the same property within a 6 month period
$180.00 and $1.00 per day after the 1st month of storage
$300.00 and $1.00 per day after the 1st month of storage
$180.00 and $1.00 per day after the 1st month of storage
$300.00 and $1.00 per day after the 1st month of storage
324 | Page Amusement devices (temporary approval) 2023/2024 Fee 2024/2025 Fee
$1.15 $1.15
AppearanceIndustries Bylaw2020 2023/2024 Fee 2024/2025 Fee
Gambling venueand board venue 2023/2024 Fee 2024/2025 Fee Class 4 Gambling Venue and Board Venue applications (includes 2 hours of processing) $370.00 $390.00 Additional processing time $185.00 per hour $195.00 per hour NoiseControl 2023/2024
2024/2025
$185.00 per hour $195.00 per hour
Fee
Fee
325 | Page NoiseControl 2023/2024 Fee 2024/2025 Fee Security alarms – daytime attendances Time cost charge Payable on invoice Security alarms – after hours attendances Time cost charge Payable on invoice Consultancy and survey fee $185.00 per hour $195.00 per hour Premises licences (non-food) 2023/2024 Fee 2024/2025 Fee Travelling shops (no food) $185.00 $195.00 Hairdressers $255.00 $270.00 Camping Grounds $325.00 $345.00 Hawkers (not including inside parks) $185.00 $195.00 Permanent amusement devices $185.00 $195.00 Mortuaries $255.00 $270.00 Offensive Trades $255.00 $270.00 Change of ownership (nonfood premises) $185.00 $195.00 Hardcopy application fee where no online/electronic option is available $85.00 $90.00 Late application administration fee for Special Licences (all classes) New fee in 2024-25 $120.00 Alcohollicencingfees Feesbycost/riskscore RiskCategory Cost/riskscore Application Fee Annual Fee Very Low 0-2 $699.20 $305.90 Low 3-5 $1,158.05 $742.90 Medium 6-15 $1,551.35 $1,201.75 High 16-25 $1,944.65 $1,966,50 Very High 26+ $2,294.25 $2,731.25
Speciallicences
Applicationfeesforspeciallicencesarecalculatedaccordingtothesizeand frequencyoftheeventoreventscoveredbythespeciallicence. Special licence
(400+
• more than 3 medium events (100400 people)
• more than 12 small events (less than
Otherfees
Environmental policy
RequestsforchangestoDistrictPlan
Allactualcostsrelatedtotheproposedplanchange,includingCouncilofficers’time, willbebornebytheapplicantasfollows:
All work undertaken by Council’s officers in
326 | Page
class Type/number of events 2023/2024 Fee 2024/2025 Fee Class 1
1x large size event
people) OR
•
OR
$1,092.50 $1,092.50 Class 2 • 1-3 medium events (100-400 people) OR
3-12 small events (less than 100 people) $393.30 $393.30 Class 3 • 1-2 small events (less than 100 people) $120.15 $120.15
100 people)
•
Description 2023/2024 Fee 2024/2025 Fee Manager's certificate - new or renewal application $316.25 $316.25 Temporary Authority (3 month term) $563.75 $563.75 Appeal to Alcohol Regulatory and Licensing Authority (ARLA) $517.50 $517.50 Public Notice for Alcohol Licence applications (Council website) $150.00 $155.00
Feetype 2023-2024 Fee 2024-2025 Fee Requests for Change to District Plan (deposit) $11,000.00 $11,500.00
Business
hour
Support: $150.00 per
Business Support: $150.00 per hour
connection with the request for the change shall be charged against the deposit at:
Hearing Commissioner time shall be recovered for time spent in hearings and deliberating.
Council Commissioners:
Chair:
Members:
Independent Commissioners:
Chair:
Member of hearing panel:
Pleasenote:
• If the proposed change is notified publicly, advertising charges will be actual costs payable by the applicant.
• All information requested by the Council shall be supplied at the applicant’s cost.
• All work undertaken by independent consultants, advisors and/or specialists in connection with the request for the change shall be charged at the actual costs plus disbursements against the deposit.
• Actual costs of any external venue or equipment hire to run a successful hearing shall be borne by the applicant.
NoticeofRequirementandAlterationstoNoticesofRequirement
Allactualcostsrelatedtotherequirement,includingCouncilofficers’time,willbe bornebytheRequiringAuthorityasfollows:
All work undertaken by Council officers in connection with the requirement shall be
Planner:
Business
Planner:
327 | Page Feetype 2023-2024 Fee 2024-2025 Fee
Planner: $220.00 per hour Planner: $230.00 per hour
$116.00 per
$93.00 per
Actual cost Actual cost $116.00 per hour $93.00 per hour Actual cost Actual cost
hour
hour
Feetype 2023-2024 Fee 2024-2025 Fee Notice of Requirement and Alterations to Notices of Requirement (deposit) $11,000.00 $11,500.00
Business
$150.00 per hour
Support:
$220.00 per hour
Support: $150.00 per hour
$230.00 per
hour
charged against the deposit at:
Hearing Commissioner time shall be recovered for time spent in hearings and deliberating.
Council Commissioners:
Chair Members Independent Commissioners:
Chair
Member of hearing panel
Pleasenote:
• Iftherequirementisnotifiedpublicly,advertisingchargeswillbeactualcosts payablebytheRequiringAuthority.
• AllinformationrequestedbyCouncilshallbesuppliedattheRequiring Authority’scost.
• Allworkundertakenbyindependentconsultants,advisorsand/orspecialists inconnectionwiththerequirementshallbechargedattheactualcostsplus disbursementsagainstthedeposit.
• Actualcostsofanyexternalvenueorequipmenthiretorunasuccessful hearingshallbebornebytheapplicant. Purchasingaprinted
Costs will be dependent on the officer time required.
Business Support: $150.00 per hour
Planner: $220.00 per hour
We encourage use of the ePlan.
Costs will be dependent on the officer time required.
Business Support: $150.00 per hour
Planner: $230.00 per hour
328 | Page Feetype 2023-2024 Fee 2024-2025 Fee
$116.00 per hour $93.00 per
Actual cost Actual cost $116.00 per hour $93.00 per hour Actual cost Actual cost
hour
theDistrictPlan Service 2023-2024 Fee 2024-2025 Fee Electronic Copy Availableonline free of charge Availableonline free of charge
We encourage
copyof
Complete Set
use of the ePlan.
Includesallgardenwaste.Greenwastemustnotbemixedwithgeneralrefuse.Only appliestovehiclesthatcanaccessthetransferstation.
329 | Page Landfill Generalrefusecharges(anymixedrubbishloads) Service 20232024 Minimum charge 20232024 Cost per tonne 20242025 Minimum charge 2024-2025 Cost per tonne All light vehicles (cars, vans, utilities, including those with trailers) $25.00 $233.00 $25.00 $260.00 All other vehicles $116.50 $233.00 $120.00 $260.00
Greenwastecharges
Service 20232024 Minimum charge 20232024 Cost per tonne 20242025 Minimum charge 2024-2025 Cost per tonne All vehicles $15.00 $126.50 $15.00 $126.50 Specialandhazardouswastecharges Service 2023-2024 Minimum charge 2023-2024 Cost per tonne 20242025 Minimum charge 2024-2025 Cost per tonne Household hazardous waste (household quantities only, normal charges otherwise apply) Free Free Free Free Tyres (cost applies to any disposal involving more than four tyres) $308 $616 $1,000 $2,000 Polystyrene (prior approval required) $308 $616 $2,500 $5,000 Special waste - general (prior approval required)) $159 $318 $170 $346 Asbestos (prior approval required) Price on Application Price on Application $180 $366 Special waste – contaminated soil (prior approval required) - - $250 $500
Libraries
Interloans (urgent)
Lost/damaged items
Hot
Subscription access for anyone living outside the SMART libraries area who does not own a ratepaying property withing the SMART libraries area
Cost of the item at time of purchase by Hutt City Libraries
Cost of the item at time of purchase by Hutt City Libraries
Littering infringement Litteringfines
Minor littering
Including but not limited to:
• cigarette butts
• wrappers/paper
• chewing gum
• small amount of food waste
• take-away food/drink containers
• fish and chip papers
• plastic drink bottle(s) and aluminium can(s)
• domestic/commercial waste in, or by, public litter bins
• single small bag of refuse
330 | Page
Description 2023-2024 Fee 2024-2025 Fee Interloans (non-urgent)
$15.00 $15.00
per request
At
At
cost
cost
Picks rental books $4 for 2 weeks $4 for 2 weeks
for three months $60
six
$120 for one year $30 for three months $60
six
$120
Photocopying and printing B&W A4 $0.20 B&W A3 $0.40 Colour A4 $1.00 Colour A3 $2.00 B&W A4 $0.20 B&W A3 $0.40 Colour A4 $1.00 Colour A3 $2.00
$30
for
months
for
months
for one year
Typeof littering 2023-2024 Fee 2024-2025 Fee
$100.00 $100.00
Medium littering
Including but not limited to:
• multiple small bags, one to three large bags or boxes of refuse
• small furniture items
• small amounts of discard due to an insecure load from truck or trailer
Major littering
Including but not limited to:
• any large volume of household/commercial/ green waste
• car parts
• large furniture items
• four or more large rubbish bags
• hazardous rubbish such as used nappies, needles, sanitary pads, broken glass, wood with nails and sharp metals.
Official Information
Ifyou’relookingforaccesstoinformationaboutyourself,thisiscoveredbythe PrivacyAct2020freeofcharge.
ThereisnochargeforstandardrequestsmadeundertheLocalGovernmentOfficial InformationandMeetingsAct1987.
Nochargeswillapplywheretheinformationcannotbereadilyfound,orfortime spentdecidingwhetherinformationwillbereleased.
Thefollowingchargeswillapplyfornon-standardrequestsmadeundertheLocal GovernmentOfficialInformationandMeetingsAct1987.
Chargeswillbenotifiedandagreedwiththerequesterbeforeanycopying, scanning,collationorredactioniscarriedout.
Achargemaybemodifiedorwaivedatthediscretionofageneralmanager:
• iftheinformationisinthepublicinteresttorelease,
331 | Page Typeof littering 2023-2024 Fee 2024-2025 Fee
$200.00 $200.00
$400.00 $400.00
• ifpaymentmightcausefinancialhardship,
• orwheretheinformationassistspublicorganisationsintheirwork.
Reproductioncharges
Photocopying A3/A4 - up to 20 pages Free of charge Free of charge
Photocopying A3/A4 - over 20 pages $0.20 per page $0.20 per page
Scanning or copying of items larger than A3
Charged on a case-by-case basis depending on size, original format and condition
Substantialcollationandredaction
Reproduction costs: As notified on request
Staff time: $40.00 per half hour
Reproduction costs: As notified on request
Staff time: $40.00 per half hour
Forrequestswhichrequiresubstantialcollation,scanningand/orredactionbefore release(non-standard)thefollowingchargeswillapply:
Any external contractor time as required
Expensecharges
Allchargeswillneedtobepaidbeforeyoureceivetheinformationyouhave requested.Allchargesincurredwillbefixedsotorecovertheactualcosts involved,including:
• Photocopying–thefirst20pagesarefree.EveryA4pageafterthatwillbe chargedat20cents.
• Producingadocumentbycomputerorsimilarequipment
• Reproducingaphotograph,film,videooraudiorecording
• Viewingorhearingavisualoraudiorecording
• Providingacopyofanymap,planorotherdocumentlargerthanA4
• Retrievalofinformationoffsiteoranysituationwhereadirectchargeis incurredinprovidingtheinformation
Parking
Payanddisplaymetersoperatebetween9amand5pm,MondaytoFriday.
Youcanpay:
• with coins or by credit card.
332 | Page
Feetype 2023-2024 Fee 2024-2025 Fee
Feetype 2023-2024 Fee 2024-2025 Fee First hour of staff time Free of charge Free of charge Charge per additional half hour of staff time or part thereof $40.00 $40.00
Actual cost Actual cost
• through the free PayMyPark website or app - pay your parking from your smartphone and extend your time remotely.
• with a SmartPark in-car meters that you can top-up online.
333 | Page
Parking Zone 2023-24 Zone Conditions 2023-2024 Charges 2024-25 Zone Conditions 2024-2025 Charges Shoppers (Green HC2) Zone Two-hour maximum parking duration Monday to Friday 9am–5pm Saturday and Sundays, P120 zones (no charge) Sunday and public holidays unrestricted $2.00 per hour Two-hour maximum parking duration outside of signposted restrictions 9am–5pm Public holidays unrestricted Enforcement 7 days per week $3.00 per hour Commuter (Yellow HC3) Zone No daily maximum parking duration Monday to Friday 9am–5pm Saturday and Sundays,
zones (no charge) Saturday, Sunday and public holidays unrestricted $2.00 per hour $7.00 maximum daily charge No daily maximum parking duration outside of signposted restrictions 9am–5pm Public holidays unrestricted Enforcement 7 days per week $3.00 per hour $10.00 maximum daily charge Commuter (Orange HC4) Zone No daily maximum parking duration Monday to Friday 9am–5pm $2.00 per hour $7.00 maximum daily charge No daily maximum parking duration outside of signposted restrictions $3.00 per hour $10.00 maximum daily charge
P120
Riverbank car park (Light Blue) Zone
Saturday and Sundays, P120 zones (no charge)
Saturday, Sunday and public holidays unrestricted
No daily maximum parking duration
Sunday and public holidays unrestricted
MondayFriday 9am5pm: $2.00 per hour $7.00 maximum daily charge
Saturday 7am2pm: $2.00 per hour $4.00 maximum daily charge
Monthly pass*: $100.00
–5pm Public holidays unrestricted Enforcement 7 days per week
daily maximum parking duration Public holidays unrestricted Enforcement 7 days per week $3.00 per hour $10.00 maximum daily charge
Monthly pass*: $150.00
334 | Page Parking Zone 2023-24 Zone Conditions 2023-2024 Charges 2024-25 Zone Conditions 2024-2025 Charges
9am
No
Petone parking New fee in 202425 New fee in 2024-25 No daily maximum parking duration outside of signposted restrictions 9am–5pm Public holidays unrestricted Enforcement 7 days per week $3.00 per hour $10.00 maximum daily charge
*RiverbankcarparkmonthlypassesreducedinpriceforDecemberandJanuary. PassescanbepurchasedfromCouncil'sbuildingat30LaingsRoadinLowerHuttor thePayMyParkApp. Infringementsformeteredparking
paying the required fee
335 | Page
Infringement 2023-2024 Charge 2024-2025 Charge Parked in a metered area without
$40.00 $40.00 Parking on a mobility car park without displaying a
mobility pass card $150.00 $150.00 Overstaying excess time 2023-2024 Charge 2024-2025 Charge Less than 30 minutes $12.00 $12.00 More than 30 minutes but less than 1 hour $15.00 $15.00 More than 1 hour but less than 2 hours $21.00 $21.00 More than 2 hours but less than 4 hours $30.00 $30.00 More than 4 hours but less than 6 hours $42.00 $42.00 More than 6 hours $57.00 $57.00 EVchargingstations Description 2023-2024 Charge 2024-2025 Charge If pricing based on power consumption only ($/kWh) Not applicable Maximum cost per kWh: $0.75/kWh If combined pricing based on power consumption and time ($/kWh and $/min) Maximum cost per kWh when charging: $0.31 Maximum cost per minute when charging: $0.31 Maximum cost per minute when not charging: $0.31 Maximum cost per kWh when charging: $0.31 Maximum cost per minute when charging: $0.31 Idle fees ($/min) Maximum cost per minute when not charging: $1
valid
336 | Page Kerbsiderubbish and recycling Service change 2023-2024 Charge 2024-2025 Charge Additional/replacement/new wheelie bin for rubbish $110.00 $115.00 Additional/replacement/new wheelie bin for recycling $110.00 $115.00 Additional/replacement/new glass crate $45.00 $45.00 Additional/replacement/new wheelie bins for rubbish and recycling and glass crate $155.00 $160.00 Servicefeesapplyforanybinchangesexceptdownsizingofrubbishbinsand upsizingofrecyclingbins. Roading Roadingfeesandcharges Subdivision inspection &approval charges 2023-2024 Charge 2024-2025 Charge Boundary adjustment $220.00 $320.00 All business support/administration $150.00 per hour $200.00 per hour All processing or monitoring by engineer $150.00 per hour $250.00 per hour All processing or monitoring by senior/principal engineer $220.00 per hour $320.00 per hour VehicleCrossings Council installed motor crossing charges* 20232024 charge 2023-2024 Admin/inspection charge 20242025 charge 2024-2025 Admin/inspection charge Concrete dished crossing per square metre $216.00m2 $173.00m2 Service and fee to be removed Extensions to existing concrete crossings per square metre $216.00m2 $173.00m2 Service and fee to be removed Installation of concrete dished crossing in conjunction with road $87.00m2 $173.00m2 Service and fee to be removed
*Trafficmanagementcostsareadditionalandwillbeadvisedatthetimeof quotation.
CorridorAccessRequests
InaccordancewithClause6.5CorridorManagerCostRecoveryintheNational Code,CouncilisabletorecovercostsinadministeringandmonitoringCorridor AccessRequests(CAR)consentcompliance.
Since1July2015HuttCityCouncilalignsitselfwithUpperHuttCityCouncil’sfeesand chargesforprocessingCAR.Thisincludeschargingafeefortexturizingsealcoats wheretrenchesarelocatedwithinthecarriageway.
337 | Page
installed motor crossing charges* 20232024 charge 2023-2024 Admin/inspection charge 20242025 charge 2024-2025 Admin/inspection charge reconstruction work per square metre Concrete block crossing/pipe crossing/'Slot' type crossing per square metre $216.00m2 $173.00m2 Service and fee to be removed
Council
Privately installed motor crossing charges 20232024 charge 2023-2024 Admin/inspection charge 20242025 charge 2024-2025 Admin/inspection charge Deposit for privately installed crossing ($336.00 refunded
of crossing) $325.00 $216.00 $336.00 $223.35 Deposit for installation of a Heavy Duty or Extra Heavy Duty vehicle crossing ($569.00
crossing) $550.00 $216.00 $569.00 $223.35
upon satisfactory completion
refunded upon satisfactory completion of
Request type 2023-2024 Charge 2024-2025 Charge Corridor Access Request - Minor Work (per CAR request) $190.00 $228.00 Corridor Access Request - Major Work (per CAR request) $230.00 $260.00
Signboardhireandproductioncosts
TherearefoursignboardslocatedinLowerHuttthatcanbehiredoutbytheweek. Theweeklyhirefeesincludeinstallationandremovalcosts.Totalpriceforhiringis weeklyhirefeeplusproductioncostsplusGST. AllpricesareexclusiveofGST.
2023-2024Charges
338 | Page Request type 2023-2024 Charge 2024-2025 Charge Corridor Access Request - Project Work (per CAR request) $1,160.00 $1392.00 Fee the texturizing seal coat of a trench in carriageway $7.60/m2 $9.20/m2 Re-inspection Fee $216.00 per inspection $228.00 Cancellation &Reinstatements Work Access Permit Extension $100.00 $110.00 Traffic Management Plan Amendment $100.00 $110.00 Road Closure Request $150.00 $165.00 Global Corridor Access Request (GTMP) $416.00 $458.00 Non-conformancePenalty Fees Minor $250.00 $275.00 Major $800.00 $880.00 Non-notification Penalty $300.00 $330.00 Other Investigations Skip bin on road reserve within corridor access (per week) $80.00 $88.00
Signboard location SideAhire per week SideA production per booking SideB Hire per week SideB production per booking Ewen Bridge $147.00 $168.00 $147.00 $168.00 Waione Street Bridge, Seaview $147.00 $168.00 $105.00 $168.00 Kennedy Good Bridge, Avalon $147.00 $168.00 $105.00 $168.00
2024-2025Charges
Sportsfields and parks
Seasoncharges
Settorecoverthepercentageofoperatingcostidentifiedbelowplusthefull operatingcostofancillaryservices:
One-offorsingledayhire
Wecharge10percentoftheseasonchargepergame,or15percentoftheseason chargeperdayifthegamelaststhreehoursorlonger.
339 | Page Signboard location SideAhire per week SideA production per booking SideB Hire per week SideB production per booking Cambridge Terrace, Naenae $105.00 $168.00 $105.00 $168.00 All four signboards $545.00 $670.00 $460.00 $670.00
Signboard location SideAhire per week SideAproduction per booking SideB Hire per week SideB production per booking Ewen Bridge $155.00 $175.00 $155.00 $175.00 Waione Street Bridge, Seaview $155.00 $175.00 $110.00 $175.00 Kennedy Good Bridge, Avalon $155.00 $175.00 $110.00 $175.00 Cambridge Terrace, Naenae $110.00 $175.00 $110.00 $175.00 All four signboards $575.00 $710.00 $485.00 $710.00
2023–2024 2024–2025 Recovery rates percentage Lev el 1 Lev el 2 Lev el 3 Childre n Training/Win ter Lev el 1 Lev el 2 Lev el 3 Childre n Trainin g/ Winter Sports 30% 20% 10% 5% 5% 30% 20% 10% 5% 5% Cricket/Croq uet 25% 15% 10% 5% N/A 25% 15% 10% 5% N/A
Specialeventscharges
Wechargefeesforhiringoutsportsgroundsforeventsandotherspecialevents.Our feesandchargesincludegoodsandservicestax(GST).
340 | Page
Service 2023-2024 Charge 2024-2025 Charge Events and commercial operators Get in touch Get in touch Picnic bookings (30 or more people) $55.00 $58.00 Filming $443 per day $470 per day Marquees for picnics/promotions - small $109.00 $116.00 Marquees for picnics/promotions - up to 50m² $219.00 $232.00 Marquees for picnics/promotions - up to 100m² $443.00 $470.00 Marquees for picnics/promotions - larger $667.00 $707.00 Weddings $109.00 $116.00 Hire of rooms, social facilities and training fields Get in touch Get in touch No. 1 field at Hutt Recreation Ground Get in touch Get in touch Note:We
season-long
Swimming Pools Casual Rates 2023-2024 Charge 2024-2025 Charge Adult $6.50 $7.00 Child $4.50 $5.00 Over 65s $5.00 $5.30 Spectator (non-supervising adult) $2.80 $3.00 Family pass (two adults/four children) $23.80 $25.00 Concession Rates 2023-2024 Charge 2024-2025 Charge Adult 10 swim $55.50 $63.00 Adult 30 swim $135.90 $182.00 Accessibility 10 swim (for people with disability) Carers or support people assisting receive free admission $41.00 $43.00
givepriorityto
bookingsovercasualbookings.
VenueHire
Principles:
• Spaces should be optimised, multi-purpose and flexibleand serve a wide range of activity,
• Given population growth, increased residential density and the loss of other community spaces (churches etc), spaces need to be fairlyshared across different groups (some historic arrangements may need to be revisited and quotas applied to enable this),
• Charges should reflect the type of activity taking place,
• Charges should be within Council’sRevenue and Finance Policy guidelines.
341 | Page Concession Rates 2023-2024 Charge 2024-2025 Charge Child 10 swim $36.00 $45.00 Child 30 swim $87.60 $130.00 Over 65s 10 swim $40.50 $47.70 Over 65s 30 swim $99.90 $137.80 Pool hire 2023-2024 Charge 2024-2025 Charge Regular hire (25 metres per hour) $75.00 $80.00 Casual hire (25 metres per hour) $135.00 $143.00 Regular hire (50 metres per hour)Wainuiomata pool $165.00 $175.00 Casual hire (50 metres per hour)Wainuiomata pool $275.00 $292.00 Lane charge (25 metres per hour) $26.00 $28.00 School groups 2023-2024 Charge 2024-2025 Charge Group hire for lessons (per head) $1.80 $2.00 Meeting rooms 2023-2024 Charge 2024-2025 Charge Casual hire (per hour) $28.00 $30.00
RateCategories Description Commercial rate –Base Rate Charged to business and groups thatare generating recvenue from their activitybeyond cost recovery of the
Significant individual benefit rate - 80% of Base Rate
Community rate
50% of Base Rate
Partner rate
0%-50% of Base Rate
Community halls:
event.
Private events that are not open to all – eg: weddings, parties, celebrations and faith-based groups. This includes churches.
Community group for community benefit and does not charge attendees per session.
Activities which are open and free to attend and/or developed or delivered in partnership with Council and/or deliver strongly to Council’s equity priority and / or focus areas of wellbeing activity may -at officers discretion –be reduced down to 0%
Hourly rates for hall hire are set out below.
• Annual EOI process to identify regular hirers wanting access to the same space, selection by assessment and / or ballot.
342 | Page
Moera, Eastbourne, Belmont, Treadwell and Wainuiomata Community halls 2023-2024Charge 2024-2025Charge Community Commercial Community Individual Benefit Commercial Monday –Friday $20.00 $32.00 $20.00 $33.00 $42.00 Weekends and public holidays $20.00 $37.00 $24.00 $38.00 $48.00 Russell KeownHouse 2023-2024Charge 2024-2025Charge Community Commercial Community Individual Benefit Commercial Per hour $10.00 $20.00 $13.00 $21.00 $26.00 Up to 4 hours $16.00 $32.00 $21.00 $33.00 $42.00 Full day $28.00 $56.00 $36.50 $58.00 $73.00 MinohHouse 2023-2024Charge 2024-2025Charge Community Commercial Community Individual Benefit Commercial Education Session $60.00 $78.00 $125 $156.00
Neighbourhood Hub BookableSpaces
• Includes AV for where AV is supplied,
• Weekend bookings between 7am Saturday and 7pm Sunday attract a 10% premium,
• Annual EOI process to identify regular hirers wanting access to the same space, selection by assessment and / or ballot.
343 | Page Half day $100.00 $130.00 $208 $260.00 Full day $200.00 $260.00 $416 $520.00 SocialEvents $200.00 $260.00 $416 $520.00
Meetingrooms in Neighbourhood Hubs 2023-2024Charge 2024-2025Charge Community Commercial Community Individual Benefit Commercial Eastbourne –small $15.00 $16.50 $26.00 $32.50 Koraunui –small $10.00 $15.00 $16.50 $26.00 $32.50 Walter Nash –small $15.00 $20.00 $16.50 $26.00 $32.50 Wainuiomata –meeting $15.00 $29.00 $19.00 $30.00 $38.00 Petone –Boardroom $9.00 $19.00 $30.00 $38.00 Eastbourne –Boardroom $9.00 $19.00 $30.00 $38.00 Koraunui –medium A $15.00 $20.00 $19.00 $30.00 $38.00 Koraunui –medium B $20.00 $25.00 $19.00 $30.00 $38.00 Koraunui –Large A $35.00 $50.00 $32.50 $52.00 $65.00 Koraunui –Large B $35.00 $50.00 $32.50 $52.00 $65.00 Koraunui –Large A& B $70.00 $100.00 $65.00 $104.00 $130.00 Walter Nash –large $35.00 $55.00 $32.50 $52.00 $65.00
344 | Page Meetingrooms in Neighbourhood Hubs 2023-2024Charge 2024-2025Charge Community Commercial Community Individual Benefit Commercial Walter Nash –large combined $65.00 $110.00 $65.00 $104.00 $130.00 WalterNash Courts 2023-2024 Charge 2024-2025Charge Regular Casual Discounted: M-F 6am-6pm & S&S 6pm-10pm Standard: M-F 6pm–10pm & S&S 7am-6pm One court $45.00 $77.00 $45.00 $64.00 Two courts $85.00 $139.00 $80.00 $114.00 Three courts $125.00 $206.00 $115.00 $164.00 Four courts $155.00 $258.00 $150.00 $214.00 Five courts $185.00 $309.00 $185.00 $264.00 WalterNash Stadiums 2023-2024Charge 2024-2025Charge Flat rate, maximum charges for community use. Commercial activities incur separate charges available on inquiry. Community Individual Benefit Commercial Front stadium –all day $1,600 $1,040 $1,664 $2,080 Front stadium – ½ day $800 $520 $832 $1,040 Back stadium –full day $1,200 $780 $1,248 $1,560 Back stadium – ½ day $600 $390 $624 $780 Full facility –all day $3,600 $2,340 $3,744 $4,680 Full facility –½ day $2,500 $1,625 $2,600 $3,250
equipment, cleaning, security
on
Note: Charges are for venue only with separate charges applying for
etc
enquiry.
Note: 25% discount for community organisations.
in 2023–24)
Post event reset and tech check
in 2023–24)
345 | Page
Theatre 2023–2024 Monday to Friday Weekends and public holidays Monday to Friday Weekends and public holidays Hours and sessions (Jan–Aug) (Jan–Aug) (Sep–Dec) (Sep–Dec) One session (8am-1pm, 1pm6pm or 6pm-11pm) $160 $235 $175 $255 Two sessions in one day $260 $350 $180 $380 Three sessions in one day $385 $525 $420 $575 Per hour after 11 pm $90 $125 $95 $135
Little
(new
$225.00
Site induction
charge
per event
(New
$225.00
cleaning (new charge
$172.50 per day/event Technician $75 hourly Minimum three hours Minimum six hours for bookings over three days Hours and sessions 2024–2025 Monday to Friday Weekends and public holidays Full Day Hire (8am-11pm) $420 $575 Per hour after 11 pm $95 $135
charge
per event Site
in 2023-24)
346 | Page DowseMuseum Room charges (per hour) 2023–2024 2024–2025 James Coe 1 $70.00 $75.00 James Coe 2 $60.00 $65.00 Foyer $65.00 $70.00 Meeting room $35.00 $40.00 Courtyard $35.00 $40.00 James Coe Centre (JC1+JC2) $115.00 $125.00 James Coe 2 and foyer $115.00 $125.00 JCC and foyer $170.00 $175.00 Staffcharges(perhour) Duty Manager $40.00 $40.00 Bar Staff/After Hours $35.00 $35.00 Security Staff $55.00 $60.00 Discountrates Hutt City Council 20% 20% Community 60% 60% Post event cleaning cost (new charge in 2023–24) $50.00 $50.00 Tradewasteclass 2023–2024 2024–2025 Consent Fees Consent + $165 if conditional consent required Consent Fees Consent + $175 if conditional consent required Class 1: High risk $1,750 $1,915 $1845.00 $2020.00 Hours and sessions 2024–2025 Monday to Friday Weekends and public holidays Note: 25% discount
organisations. Site induction (new charge in 2023–24) $225 per event Post event reset and tech check $225 per event Site cleaning $172.50 per event Technician* $75 hourly *Minimum three hours,
for community
347 | Page 2023–2024 2024–2025 Consent Fees Consent + $165 if conditional consent required Consent Fees Consent + $175 if conditional consent required Class 2: Moderate risk $885 $1,050 $935.00 $1110.00 Class 3: Low risk $495 $660 $520.00 $695.00 Class 4: Minimal risk $265 $430 $280.00 $455.00 Class 5: Minimal risk low flow $130 N/A $135.00 N/A Application fee $100 $105 Re-inspection fee $125 $130.00 Late payment additional fee $105 $110.00 Transfer additional fee $50 $55.00 Tradewasteuser charges 2023–2024 2024–2025 Flow $0.549 per cubic metre $0.579 per cubic metre Total suspended solids $1.192 per kilogram $1.256 per kilogram COD (chemical oxygen demand) $0.417 per kilogram $0.440 per kilogram ServiceConnection Applications ServiceConnection 2023-2024 Fees 2024-2025 Fees Sewer/Wastewater $130.00 $140.00 Stormwater $130.00 $140.00 Water $130.00 $140.00 Water 2023–2024 2024–2025 Fee for use of water by builders on unmetered industrial and commercial sites $130.00 $140.00 Chargefor ordinary supply Class 2Water Minimum charge per cubic metre $3.35 $4.25 Water supplied by hydrant Per cubic metre $3.35 $4.25 Minimum charge $130.00 $140.00
Ngā whakamāramatanga –
Definitions
10YearPlan – A plan that describes the activities of a localauthority, its community outcomes, and its long-term focus in terms of decisions and activities. This is the same as our Long-Term Plan (LTP).
Activitystatement-This statement describes the amount of money needed to operate and maintain facilitiesand services and to cover capital expenses within an activityfunction.
AnnualPlan – A planthat describes the activities of the localauthority in relation to the LTP, with a particular focus on the financialyear for which the document is produced.
Asset – Something of value thatCouncil ownson behalf of the people of Te Awa Kairangi ki Tai Lower Hutt, such as roads, drains, parks, and buildings.
AssetManagementPlan – A long-term planfor managing an asset to ensure that it continues to have the capacity to provide anagreed level of service and that costs over the life of the asset are minimised.
Assumptions/assumed– refers to accepting certain conditions or premises as true or valid without explicit confirmation, often used as the basis for decision-making or planning.
Balancedoperatingbudget-A balanced operating budget occurs when a Council's projected operating revenue matches or exceeds its planned operating expenditure, ensuring that the Council does not spend more than it earns.
Borrowings-refers to obtaining fundsfrom external sources, typicallythrough loans or bonds, to financeprojects or cover expenses.
Capitalexpenditure – Money spent on acquiring or building long-term Council assets.
Capitalvalue-The value of land plus additions such as buildings, driveways, and fences.
CentralBusinessDistrict(CBD) – Te AwaKairangi kiTai Lower Hutt’s citycentre.
CommunityBoards – A local elected body setup under the Local Government Act 2002. Community boards are consulted by Council and can represent community concerns to Council. Hutt City Council has three community boards: Eastbourne, Petone and Wainuiomata.
348 | Page
Compliance-Compliance refers to adhering to relevant laws, regulations, policies, and standards setforth by governing bodies or authorities, ensuring that the Council operates within legal and ethical boundaries.
ConsultationDocument-a document that clearly explains matters proposed to be included in the 10 Year Plan and provides an opportunity for the public to participate in decision making.It explains objectives, significantissues, and how rates, dept and levels of service mightbe affected asa resultof those decisions. The content requirements of the consultation document are set out in the Local Government Act 2002.
Council-ControlledOrganisation(CCO) – A company or Trust, in which Council isat least a 50% shareholder that independently manages facilities, delivers services, and undertakes developments on behalf of the TeAwa Kairangiki Tai Lower Hutt community. Where necessary, Council provides operational funding tothese organisations.
Criticalinfrastructure - Assets which providecritical servicesand failure of which could result in major outages or disruptions to service such as reservoirs, pumping stations and main network pipes.
Democracy-A wayCouncil govern themselves. It can be used to mean community participationin decision making between elections, as well asat elections.
Depreciation(amortisation) – anexpense charged each year to reflect the estimated cost of using our assets over their lives. Amortisation relates to ‘intangible’ assets such as software (as distinct from physical assets, which are covered bythe term depreciation).
Developmentcontribution-A payment made by a developer to cover part of the costs of providing infrastructure to a new development, i.e. “growth” related cost. EmployeeCosts – The costs of allstaff expenditure, including wages, salaries and related taxes, training, and recruitment costs. Remuneration of elected and appointed representatives is also included under this heading. This does not include CCO director fees, whichare included in operating expenditure.
FinancialYear – Council’sfinancial year runs from 1 July to 30 June of the following year.
Generalrates- The rates levied on most properties for general services including residential, rural, business and utility. They arelevied on the basis of zoning, land use and capitalvalue.
Grantorsubsidy-Money given from localor central government or other funds to a person or group for a specified purpose.
Hearing-Meeting at which members of the public speak formallyto elected representatives and/or staff aboutan issue.
Income-Revenue gained from all sources during the year, such as rates, grants, specialfunds, subsidies, and fees and charges. Income does not include loans or the proceeds in excess of the net book value from the sale of assets.
349 | Page
Inflation-Inflation isthe gradual increase in the prices of goods and services inan economy over time.
Infrastructure-The stock of fixed capitalequipment that helps a community to function. This includes thepipes and machinery that allow Council’s tocollect and manage water, wastewater, storm water and rubbish, as wellasassets such as roads and buildings.
Intergenerationalequity-refers to the principle of ensuring fairness and sustainabilityin decision-making processes that impactpresent and future generations, aiming to distribute resources, benefits, and burdens fairlyacross different generations while preserving the environment and meeting the needs of both current and future residents.
LocalGovernmentAct2002 – The keylegislation that defines the powers and responsibilities of local authorities like Hutt City Council.
LongTermPlan(LTP) – See 10-Year Plan, above. Maintenance costs – Money spent to keep the Council’s assetsin working condition, such as repairs and maintenance.
ManaWhenua – Māori who have historic andterritorial rights over the land. Mana Whenua refers to iwi and hapū who have these rights in Te Awa Kairangi kiTai Lower Hutt. The tribe’s history and legends are based in the lands they have occupied over generations and the land enables and sustains the people, the places, and the processes of Te Ao Māori (Māori worldview).
OperatingExpenditure – Money spent on theday-to-day operations of the Council. OperatingProjects – Significantprojects thatdo not result in the creation of Council assets.
PerformanceMeasure – A measure that shows how well Council isdoing in achieving the goalsit hasset for itself.
Policy- A policyis a predetermined course of action or set of guidelines established by the Council to guide decision-making, address specific issues, or achieve particular goals within the community.
PPE–An accounting term for Property, plant and equipment representing all the assets of the Council, such as land buildings, pipes, roads, community facilities.
Rates – A form of property tax. In Te Awa Kairangi ki Tai Lower Hutt, we have both General Rates and Targeted Rates. General Rates are based on a property’s capital value, and Council use this money to invest inthings likefootpaths and libraries. Targeted Rates are a fixed amount for each rating unit or separately used and inhabitable part (SUIP) of a rating unit.Targeted rates payfor things like Water or Wastewater.
ResidentsSatisfactionSurvey(RSS) – This survey is conducted using a panel system, where a group of residents receive surveys to providefeedback on the city. Resourceconsent-Where a Council, using delegated authority under the Resource Management Act, gives an applicant permission for a particularland use activity.
350 | Page
ResourceManagementAct(RMA)-Resource Management Act (RMA) isNew Zealand’s mainpiece of legislation that sets out how Council should manage our environment.
Revenue-Revenue represents the income generated by the Council through various sources, such as taxes, fees, grants, and other sources, which are crucial for funding public servicesand initiatives within the community.
Significance – The degree of importance of an issue, proposal, decision, or matter as assessed bya local authority in terms of itslikelyconsequences for the current and future social, economic, environmental, or cultural wellbeing of the community.
SignificantActivity – Anactivity deemed to be significant according to Council’s Significance and Engagement Policy.
SeaviewMarinaLimited(SML) – This isa Council-controlled organisation which is Wellington’s newest and fastest developing marina, situated atthe sheltered northeast end of Wellington Harbour.
Strategy-A policyis a predetermined course of action or set of guidelines established by the Councilto guidedecision-making, address specific issues, or achieve particulargoals within the community.
Submission-Feedback or proposalfrom a citizen or group on an issue aimed to influence judgement at the Council level attimes such as draftAnnual Plan, Long Term Plan or other new significant plans.
Targetedrate – Any rate levied other than the general rate, which is targeted at users of a service such as water supply, wastewater, refuse and recycling, and the Jackson Street Programme.
TeĀtiAwa – An iwi with historic and territorialrights over Te Awa Kairangi, Lower Hutt, and Te Upokoo Te Ika a Māui, the widerWellington region. Te Āti Awain this region share close kinship to Te ĀtiAwain northern Taranaki, Kāpitiand the northern areas of the South Island.
ThreeWaters/WaterServices-A term for grouping the three water services provided by Councils together: water supply; wastewater; and stormwater.
UrbanPlusLimited(UPL)&UrbanPlusLimitedDevelopmentsLimited(UPLDDL) –
These are Council-controlled organisations and are multidisciplined property companies. They provide high quality residential property development, rental housing portfolio management and strategic property services.
Usercharges – Income to Council through fees and charges paid by those who use specific services Councilprovides.
Wastelevy-The waste disposal levyraises revenue for initiatives to reduce waste and encourage resource recovery (e.g., composting and recycling).
WellingtonWaterLtd-Wellington region’s professional water services provider. They are 100 percent Council owned and funded, and their job isto provide safe and healthy drinking water, collect and treat wastewater, and ensure the stormwater network is well managed.
351 | Page
Worksprogramme-The works programme sets out the plans to be carried out over the next 10 years, such as pipeline renewal upgrades, enhanced cycle tracks, or equipment replacements. The schedule includes the year the work will take place, the costs of the work and the source of funding.
352 | Page
Contact details
Your Mayor and Councillors
Hutt City Council is made up of 12 Councillors and a Mayor. Along with all other local authorities in New Zealand, Council is elected every three years.
The Mayor and six Councillors are elected on a city-wide basis and six Councillors are elected to represent their respective wards, while working in the best interests of the city as a whole. There are six wards – Northern, Eastern, Central, Western, Harbour and Wainuiomata – each with one Councillor. Following elections in October 2022, a new Council was sworn in for the new triennium. You can find information about Hutt City Council’s elected members below and on our website – hutt.city/councillors
Campbell Barry
Koromatua | Mayor
Tui Lewis
Koromatua Tuarua | Deputy Mayor
Kaikaunihera ki te Whanganui
Harbour Ward Councillor
Josh Briggs
Kaikaunihera o Te Tāone Whānui
City Wide Councillor
Brady Dyer
Kaikaunihera o Te Tāone Whānui
City Wide Councillor
Simon Edwards
Kaikaunihera o Te Tāone Whānui
City Wide Councillor
Karen Morgan
Kaikaunihera o Te Tāone Whānui
353 | Page
City Wide Councillor
Tony Stallinger
Kaikaunihera o Te Tāone Whānui
City Wide Councillor
Gabriel Tupou
Kaikaunihera o Te Tāone Whānui
City Wide Councillor
Glenda Barratt
Kaikaunihera ki Te Riu
Central Ward Councillor
Keri Brown
Kaikaunihera o Wainuiomata
Wainuiomata Ward Councillor
Andy Mitchell
Kaikaunihera ki Te Rāwhiti
Eastern Ward Councillor
Chris Parkin
Kaikaunihera ki Te Uru
Western Ward Councillor
Naomi Shaw
Kaikaunihera ki Te Raki
Northern Ward Councillor
Hutt City Council
Address: Administration Building, 30 Laings Road,Lower Hutt
Postal Address: Private Bag 31 912, Lower Hutt 5010
Phone: 04 570 6666 | 0800 HUTT CITY
After hours emergencies:
04 570 6666 | 0800 HUTT CITY
Email: contact@huttcity.govt.nz
354 | Page
Website: huttcity.govt.nz
Facebook: facebook.com/huttcitycouncil
Twitter: twitter.com/huttcitycouncil
Chief Executive Tumu Whakarae: Jo Miller
Email: jo.miller@huttcity.govt.nz
Neighbourhood Hubs
War Memorial Library
Address: 2 Queens Drive, Lower Hutt
Phone: 04 570 6633
EastbourneCommunity Library
Address: 38 Rimu Street, Eastbourne
Phone: 04 562 8042
Maungaraki Community Library –
Whare Pūrākau
Address: Maungaraki School, 137 Dowse Drive, Maungaraki
Phone: 028 2550 3219
Moerā Community Library
Address: 107 Randwick Road, Moerā
Phone: 04 568 4720
Naenae Community Library
Address: Hillary Court, Naenae
Phone: 04 567 2859
PetoneCommunity Library
Address: 7 Britannia Street, Petone
Phone: 04 568 6253
Koraunui Stokes Valley
Community Hub &Library
Address: 186 Stokes Valley Road, Stokes Valley
Phone: 04 562 9050
Walter Nash Centre&Library
Address: 22 Taine Street, Taitā
Phone: 04 560 1090
Wainuiomata Community Hub &Library
Address: 1a–1c Queen Street, Wainuiomata
Phone: 04 564 5822
355 | Page
Pools
Huia Pool and Fitness
Address: Huia Street, Lower Hutt
Pool phone: 04 570 6655
Fitness suite phone: 04 570 1053
Stokes Valley Pool and Fitness
Address: Bowers Street, Stokes Valley
Pool phone: 04 562 9030
Fitness suite phone: 04 562 9030
McKenzieBaths Summer Pool
Address: 79 Udy Street, Petone
Phone: 04 568 6563
EastbourneSummer Pool
Address: Marine Parade, Eastbourne
Phone: 04 562 7582
Wainuiomata Summer Pool
Address: 2 Moohan Street, Wainuiomata
Phone: 04 564 8780
Arts and Culture
TheDowseArt Museum
Address: 45 Laings Road, Lower Hutt
Phone: 04 570 6500
PetoneSettlers Museum
Address: 130 The Esplanade, Petone
Phone: 04 568 8373
LittleTheatre
Address: 2 Queens Drive, Lower Hutt
Phone: 04 570 6500
356 | Page
Independent Auditor's Report
357 | Page